
Neuroglancer#
Note
Neuroglancer works best in Chrome and Firefox but does not always work as expected in Safari.
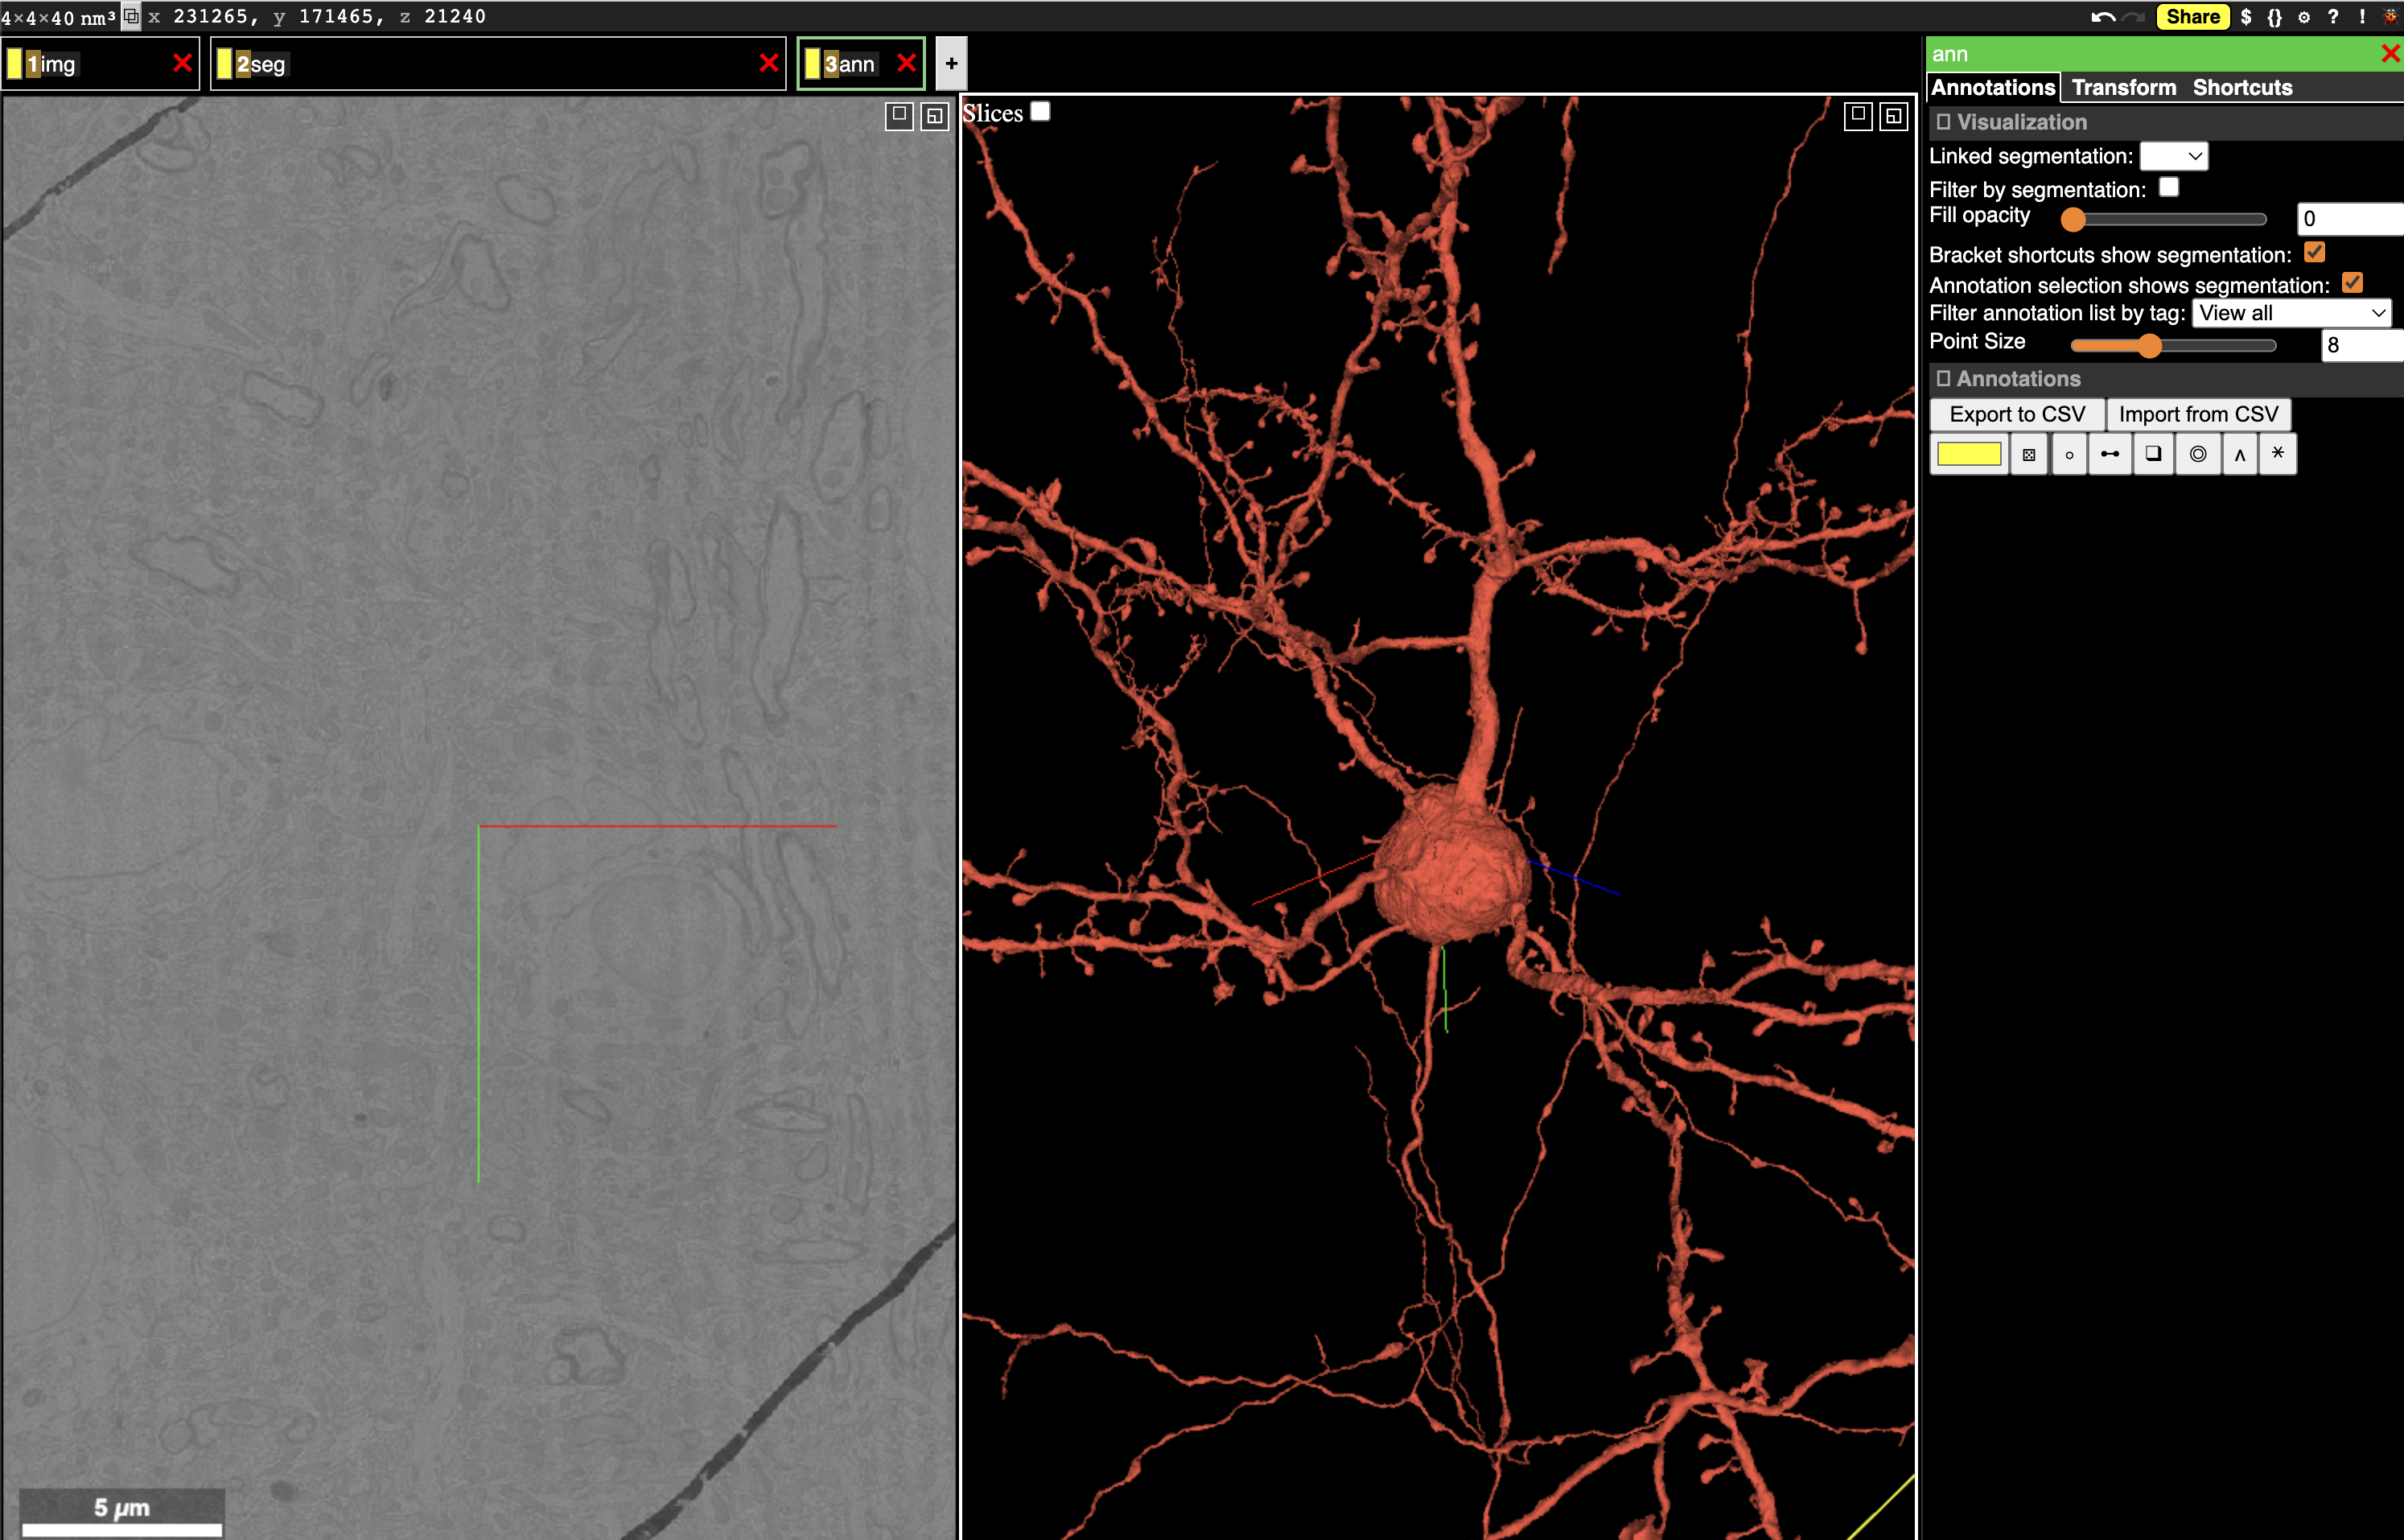
Fig. 14 Neuroglancer can show multiple layers of data, including imagery, segmentation, and more.#
Neuroglancer is a WebGL-based viewer developed by Jeremy Maitin-Shephard at the Google Connectomics team to visualize very large volumetric data, designed in large part for connectomics. We often use Neuroglancer to quickly explore data, visualize results in context, and share data.
To look at the MICrONS data in Neuroglancer, click this link. Note that you will need to authenticate with the same Google-associated account that you use to set up CAVEclient.
Interface Basics#
The Neuroglancer interface is divided into panels. In the default view, one panel shows the imagery in the X/Y plane (left), one shows a 3d view centered at the same location, and the narrow third panel provides information about the specific layer. Note that at the center of the each panel is a collection of axis-aligned red, blue and, green lines. The intersection and direction of each of these lines is consistent across all panels.
Along the top left of the view, you can see tabs with different names. Neuroglancer organizes data into layers, where each layer tells Neuroglancer about a different aspect of the data. The default view has three layers:
imgdescribes how to render imagery.segdescribes how to render segmentation and meshes.annis a manual annotation layer, allowing the user to add annotations to the data.
You can switch between layers by right clicking on the layer tab. You will see the panel at the right change to provide controls for each layer as you click it.
The collection of all layers, the user view, and all annotations is stored as a JSON object called the state.
The basic controls for navigation are:
single click/dragslides the imagery in X/Y and rotates the 3d view.scroll wheel up/downmoves the imagery in Z.right clickjumps the 3d view to the clicked location in either the imagery or on a segmented object.double clickselects a segmentation and loads its mesh into the 3d view. Double clicking on a selected neuron deselects it.control-scroolzooms the view under the cursor in or out.zsnaps the view to the closest right angle.
You can paste a position into Neuroglancer by clicking the x, y, z coordinate in the upper left corner and pasting a space or comma-separated list of numbers and hitting enter. Note that Neuroglancer always works in voxel units, and you can see the resolution of the voxels in the extreme upper left corner.
Selecting objects#
The most direct way to select a neuron is to double click in the imagery to select the object under your cursor. This will load all the voxels associated with that object and also display its mesh in the 3d view.
To see the list of selected objects, you can select the segmentation tab (right click on the seg tab).
Underneath the list of options, there is a list of selected root ids and the color assigned to them in the view.
You can change colors of all neurons randomly by pressing l or individually change colors as desired.
In addition, you can press the checkbox to hide a selected object while keeping it in the list, or deselect it by clicking on the number itself.
You can also copy a root id by pressing the clipboard icon next to its number, or copy all selected root ids by pressing the clipboard icon above the list.
This selection list also allows you to select objects by pasting one or more root ids into the text box at the top of the list and pressing enter.
Annotations#
Annotations are stored in an annotation layer.
The default state has an annotation layer called ann, but you can always add new annotation layers by command-clicking the + button to the right of the layer tabs.
To create an annotation, select the layer (right click on the tab), and then click the icon representing the type of annotation you want to use. The most basic annotation is a point, which is the icon to the left of the list. The icon will change to having a green background when selected.
Now if you control-click in either the imagery or the 3d view, you will create a point annotation at the clicked location. The annotation will appear in the list to the right, with its coordinate (in voxels, not nanometers) displayed. Clicking any annotation in the list will jump to that annotation in 3d space. Each annotation layer can have one color, which you can change with the color picker to the left of the annotation list.
Saving and sharing states#
Like many other websites that require logins, you cannot simply send your URL ot another person to have them see the view.
Instead, to save the current state and make it available to yourself or others in the future, you need to save the state with the Share button at the top right corner.
This will then give you a URL that you can copy and share with others or paste yourself.
A typical sharing URL looks like the following:
https://neuroglancer.neuvue.io/?json_url=https://global.daf-apis.com/nglstate/api/v1/4684616269037568
The first part is the URL for the Neuroglancer viewer, while the part after the ?json_url= is a URL that points to a JSON file that contains the state.
The number at the end of the URL is used to uniquely identify the state and can be used programatically to retrieve information.
Warning
If a URL contains ?local_id= instead of ?json_url, that means that it cannot be viewed by anyone else or even in another browser on your own computer.
Navigating Annotations#
Annotations in an annotation layer can be right-clicked on to jump to them, but can also be navigated as a list.
To see the list of annotations, select the annotation layer (right click on the tab).
Each annotation is listed as its location in Neuroglance voxel coordinates.
Clicking on an row in this annotation list will not only jump to it in the view, but also select it.
You can see the information about the selected neuron in the lower right corner.
Once an annotation is selected, any associated root ids are loaded.
The keys [ and ] will jump to the previous and next annotations in the list, respectively.
Each annotation can have a full-text description associated with it for adding notes. This can be added in the lower right corner.
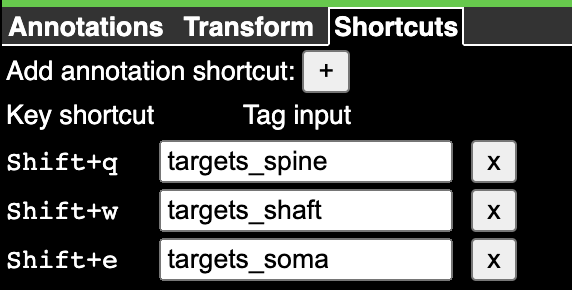
Fig. 15 Annotation tags after populating them manually.#
However, the most convenient way to label data quickly is through Tags.
To add tags, click on the Shortcuts tab within the Annotation widget on the right, and then click on the + button to add a new tag.
Each tag gets a text label and a key command to activate or deactivate it for a given annotation.
By default, the first tag is activated by pressing shift-q, the second by pressing shift-w, and so on down the qwerty line.
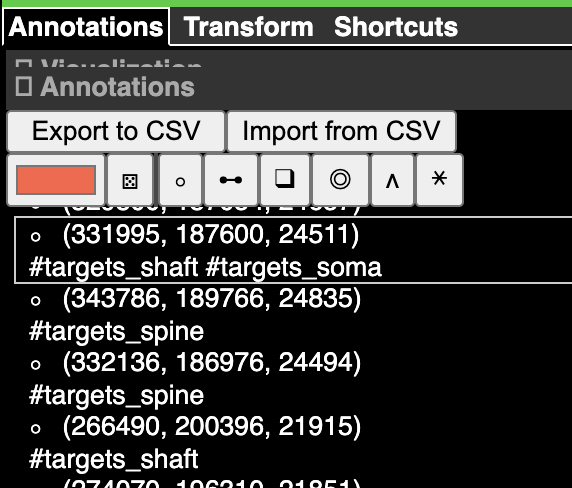
Fig. 16 Annotation tags applied to annotations. The labels with with the # symbol indicate a tag is present.#
Now when you select an annotation, you can press the key command to attach that tag to it.
Pressing the same key command will remove the tag.
Any number of tags can be added to each annotation.
Together with the [ and ] keys to navigate the list, this allows you to quickly label a large number of annotations.
Programmatic Interaction with Neuroglancer States#
Visualizing data in Neuroglancer is one of the easiest ways to explore it in its full context.
The python package nglui was made to make it easy to generate Neuroglancer states from data, particularly pandas dataframes, in a progammatic manner.
The package can be installed with pip install nglui.
Important
The nglui package interacts prominantly with caveclient and annotations queried from the database.
See the section on querying the database to learn more.
Parsing Neuroglancer states#
The nglui.parser package can be used to parse Neuroglancer states.
The simplest way to parse the annotations in a Neuroglancer state is to first save the state using the Share button, and then copy the state id (the last number in the URL).
For example, for the share URL https://neuroglancer.neuvue.io/?json_url=https://global.daf-apis.com/nglstate/api/v1/5560000195854336, the state id is 5560000195854336
You can then download the json and then use the annotation_dataframe function to generate a comprehensive dataframe of all the annotations in the state.
import os
from caveclient import CAVEclient
from nglui import parser

client = CAVEclient('minnie65_public')

state_id = 5560000195854336
state = client.state.get_state_json(state_id)
parser.annotation_dataframe(state)
| layer | anno_type | point | pointB | linked_segmentation | tags | group_id | description | |
|---|---|---|---|---|---|---|---|---|
| 0 | syns_in | point | [294095, 196476, 24560] | NaN | [864691136333760691] | [] | None | None |
| 1 | syns_in | point | [294879, 196374, 24391] | NaN | [864691136333760691] | [] | None | None |
| 2 | syns_in | point | [300246, 200562, 24297] | NaN | [864691136333760691] | [] | None | None |
| 3 | syns_in | point | [300894, 201844, 24377] | NaN | [864691136333760691] | [] | None | None |
| 4 | syns_in | point | [294742, 199552, 23392] | NaN | [864691136333760691] | [] | None | None |
| ... | ... | ... | ... | ... | ... | ... | ... | ... |
| 5272 | syns_out | point | [277152, 200746, 22723] | NaN | [864691132294257136] | [] | None | None |
| 5273 | syns_out | point | [298884, 189782, 21453] | NaN | [864691132135519710] | [] | None | None |
| 5274 | syns_out | point | [330182, 198986, 23862] | NaN | [864691132100215248] | [] | None | None |
| 5275 | syns_out | point | [326552, 186446, 24792] | NaN | [864691131892380409] | [] | None | None |
| 5276 | syns_out | point | [275784, 206898, 21524] | NaN | [864691131593914919] | [] | None | None |
5277 rows × 8 columns
Note that tags in the dataframe are stored as a list of integers, with each integer corresponding to one of the tags in the list.
To get the mapping between the tag index and the tag name for each layer, you can use the tag_dictionary function.
parser.tag_dictionary(state, layer_name='syns_out')
{1: 'targets_spine', 2: 'targets_shaft', 3: 'targets_soma'}
Generating Neuroglancer States from Data#
The nglui.statebuilder package is used to build Neuroglancer states that express arbitrary data.
The general pattern is that one makes a “StateBuilder” object that has rules for how to build a Neuroglancer state layer by layer, including selecting certain neurons, and populate layers of annotations.
You then pass a DataFrame to the StateBuiler, and the rules tell it how to render the DataFrame into a Neuroglancer link.
The same set of rules can be used on similar dataframes but with different data, such as synapses from different neurons.
To understand the detailed use of the package, please see the tutorial.
However, a number of basic helper functions allow nglui to be used for common functions in just a few lines.
For example, to generate a Neuroglancer state that shows a neuron and its synaptic inputs and outputs, we can use the make_neuron_neuroglancer_link helper function.
from nglui.statebuilder import helpers

helpers.make_neuron_neuroglancer_link(
    client,
    864691135122603047,
    show_inputs=True,
    show_outputs=True,
)
The main helper functions are:
make_neuron_neuroglancer_link- Shows one or more neurons and, optionally, synaptic inputs and/or outputs.make_synapse_neuroglancer_link- Using a pre-downloaded synapse table, make a link that shows the synapse and the listed synaptic partners.make_point_statebuilder- Generate a statebuilder that to map a dataframe containing points (by default, formatted like a cell types table) to a Neuroglancer link.
In all cases, please look at the docstrings for more information on how to use the functions.