
import numpy as np
import pandas as pd
import matplotlib.pyplot as plt
%matplotlib inline
from allensdk.core.brain_observatory_cache import BrainObservatoryCache
manifest_file = '../../../data/allen-brain-observatory/visual-coding-2p/manifest.json'
boc = BrainObservatoryCache(manifest_file=manifest_file)
Cross session data#
As many neurons are imaged across multiple session, many analyses require accessing data for those neurons from multiple data files.
As mentioned in Cell ids and indices, when neurons are matched across multiple sessions they have the same cell specimen id but they have a different cell index within each session.
Let’s consider one neuron
cell_specimen_id = 517472450
We can find the sessions for which this neuron was recorded using the get_ophys_experiments() and passing a list that contains this cell specimen id.
#pd.DataFrame(boc.get_ophys_experiments(cell_specimen_ids=[cell_specimen_id]))
As we expect, all of these sessions are from the same experiment container id each from a different session type. If this is not clear, refer to Experiment containers and session.
Let’s explore this neuron across all three sessions. First let’s get the data for all three sessions.
id_a = boc.get_ophys_experiments(cell_specimen_ids=[cell_specimen_id], session_types=['three_session_A'])[0]['id']
id_b = boc.get_ophys_experiments(cell_specimen_ids=[cell_specimen_id], session_types=['three_session_B'])[0]['id']
id_c = boc.get_ophys_experiments(cell_specimen_ids=[cell_specimen_id], session_types=['three_session_C'])[0]['id']

data_set_a = boc.get_ophys_experiment_data(id_a)
data_set_b = boc.get_ophys_experiment_data(id_b)
data_set_c = boc.get_ophys_experiment_data(id_c)
2023-08-21 08:20:19,027 allensdk.api.api.retrieve_file_over_http INFO Downloading URL: http://api.brain-map.org/api/v2/well_known_file_download/516244841
2023-08-21 08:20:34,504 allensdk.api.api.retrieve_file_over_http INFO Downloading URL: http://api.brain-map.org/api/v2/well_known_file_download/514409327
Let’s find the cell index for this neuron in each of these sessions. Recall that there are different cell indices for each session even thought the neuron has a single cell id.
index_a = data_set_a.get_cell_specimen_indices([cell_specimen_id])[0]
index_b = data_set_b.get_cell_specimen_indices([cell_specimen_id])[0]
index_c = data_set_c.get_cell_specimen_indices([cell_specimen_id])[0]

print("Session A index: ", str(index_a))
print("Session B index: ", str(index_b))
print("Session C index: ", str(index_c))
Session A index:  16
Session B index:  171
Session C index:  1
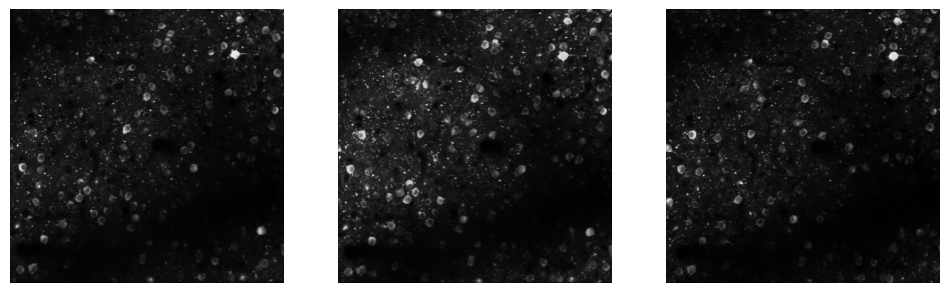
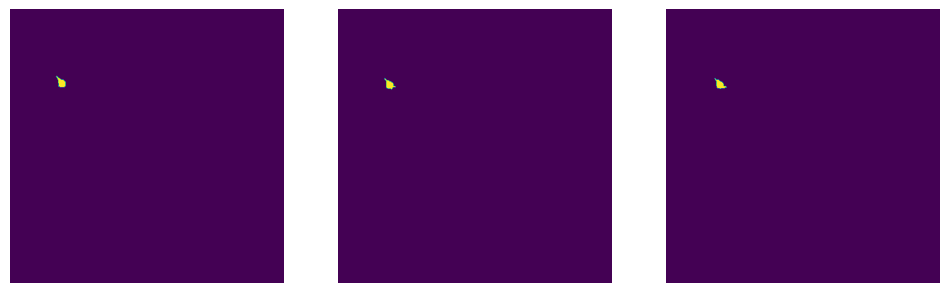
We can visualize the maximum projection for each session and see the ROI mask of the neuron in each session.
mp_a = data_set_a.get_max_projection()
mp_b = data_set_b.get_max_projection()
mp_c = data_set_c.get_max_projection()

rois_a = data_set_a.get_roi_mask_array()
rois_b = data_set_b.get_roi_mask_array()
rois_c = data_set_c.get_roi_mask_array()

fig = plt.figure(figsize=(12,5))
ax1 = plt.subplot(131)
ax1.imshow(mp_a, cmap='gray')
ax1.axis('off')
ax2 = plt.subplot(132)
ax2.imshow(mp_b, cmap='gray')
ax2.axis('off')
ax3 = plt.subplot(133)
ax3.imshow(mp_c, cmap='gray')
ax3.axis('off')

fig2 = plt.figure(figsize=(12,5))
ax4 = plt.subplot(131)
ax4.imshow(rois_a[index_a,:,:])
ax4.axis('off')
ax5 = plt.subplot(132)
ax5.imshow(rois_b[index_b,:,:])
ax5.axis('off')
ax6 = plt.subplot(133)
ax6.imshow(rois_c[index_c,:,:])
ax6.axis('off')
(-0.5, 511.5, 511.5, -0.5)
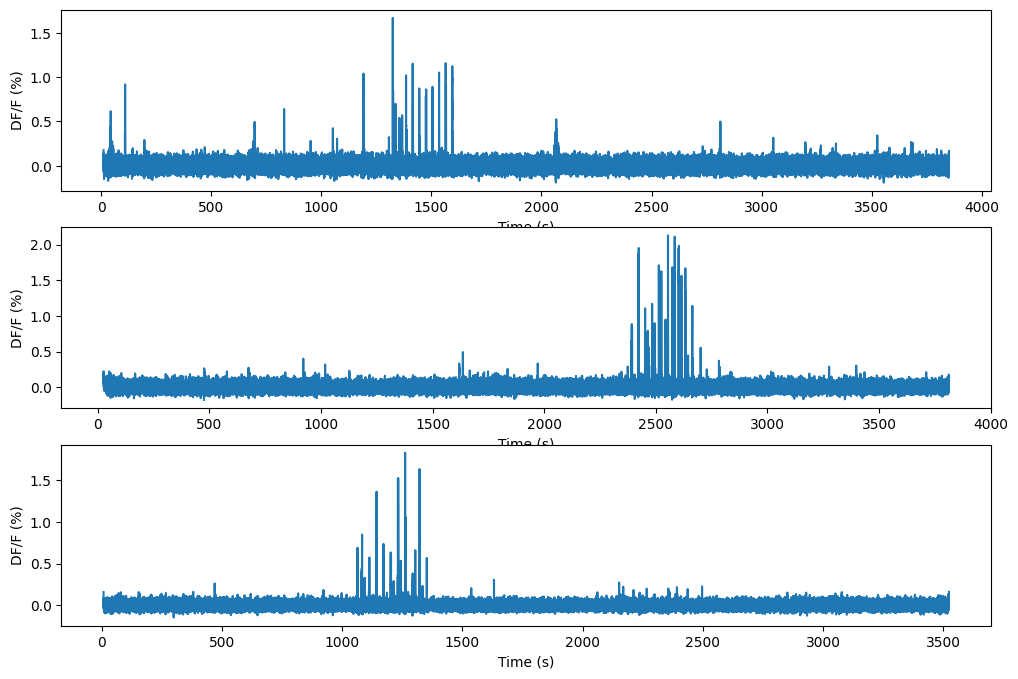
Let’s look at the activity of this neuron in each session. We’ll use the DF/F.
ts_a,dff_a = data_set_a.get_dff_traces()
ts_b,dff_b = data_set_b.get_dff_traces()
ts_c,dff_c = data_set_c.get_dff_traces()

plt.figure(figsize=(12,8))
ax1 = plt.subplot(311)
ax1.plot(ts_a,dff_a[index_a,:])
ax1.set_xlabel("Time (s)")
ax1.set_ylabel("DF/F (%)")
ax2 = plt.subplot(312)
ax2.plot(ts_b,dff_b[index_b,:])
ax2.set_xlabel("Time (s)")
ax2.set_ylabel("DF/F (%)")
ax3 = plt.subplot(313)
ax3.plot(ts_c,dff_c[index_c,:])
ax3.set_xlabel("Time (s)")
ax3.set_ylabel("DF/F (%)")
Text(0, 0.5, 'DF/F (%)')
Each experiment session consists of a different set of stimuli, but in each session has two things: at least one epoch of spontaneous activity and natural movie one.
Let’s compute the mean response of this neuron’s response to natural movie one in each session and compare them.
nm_stim_a = data_set_a.get_stimulus_table('natural_movie_one')
nm_stim_b = data_set_b.get_stimulus_table('natural_movie_one')
nm_stim_c = data_set_c.get_stimulus_table('natural_movie_one')

repeat_starts_a = nm_stim_a[nm_stim_a.frame==0].start.values
repeat_starts_b = nm_stim_b[nm_stim_b.frame==0].start.values
repeat_starts_c = nm_stim_c[nm_stim_c.frame==0].start.values

nm_a = np.empty((900,10))
nm_b = np.empty((900,10))
nm_c = np.empty((900,10))
for i in range(10):
  start_a = repeat_starts_a[i]
  nm_a[:,i] = dff_a[index_a,start_a:start_a+900]
  start_b = repeat_starts_b[i]
  nm_b[:,i] = dff_b[index_b,start_b:start_b+900]
  start_c = repeat_starts_c[i]
  nm_c[:,i] = dff_c[index_c,start_c:start_c+900]

plt.figure(figsize=(10,4))
plt.plot(nm_a.mean(axis=1), label="Session A")
plt.plot(nm_b.mean(axis=1), label="Session B")
plt.plot(nm_c.mean(axis=1), label="Session C")

plt.legend()
plt.xlabel("Time (imaging frames)")
plt.ylabel("DF/F (%)")
Text(0, 0.5, 'DF/F (%)')
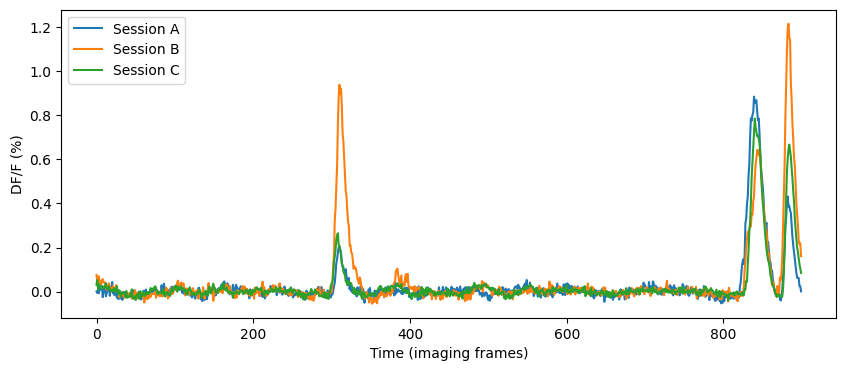
How similar are these mean responses?
import scipy.stats as st
r,p = st.pearsonr(nm_a.mean(axis=1), nm_b.mean(axis=1))
print("AB Correlation = ", str(r))

r,p = st.pearsonr(nm_a.mean(axis=1), nm_c.mean(axis=1))
print("AC Correlation = ", str(r))

r,p = st.pearsonr(nm_b.mean(axis=1), nm_c.mean(axis=1))
print("BC Correlation = ", str(r))
AB Correlation =  0.6876919774041838
AC Correlation =  0.9028353266931375
BC Correlation =  0.8303760776176358