
Visual Learning Dataset Overview#
The Visual Learning dataset was generated using in vivo Two-photon calcium imaging to measure the activity of inhibitory neurons in the primary visual cortex of mice while they learned a go/no-go visual change detection task . The same population of neurons was recorded every day across the entire training procedure, from the animal’s first exposure to the task through expert performance, novel stimulus exposure, and extinction of the learned stimulus-reward association. After the in vivo experiment was complete, the transcriptomic identity of the same neurons was measured using post-hoc spatial transcriptomics on the same tissue.
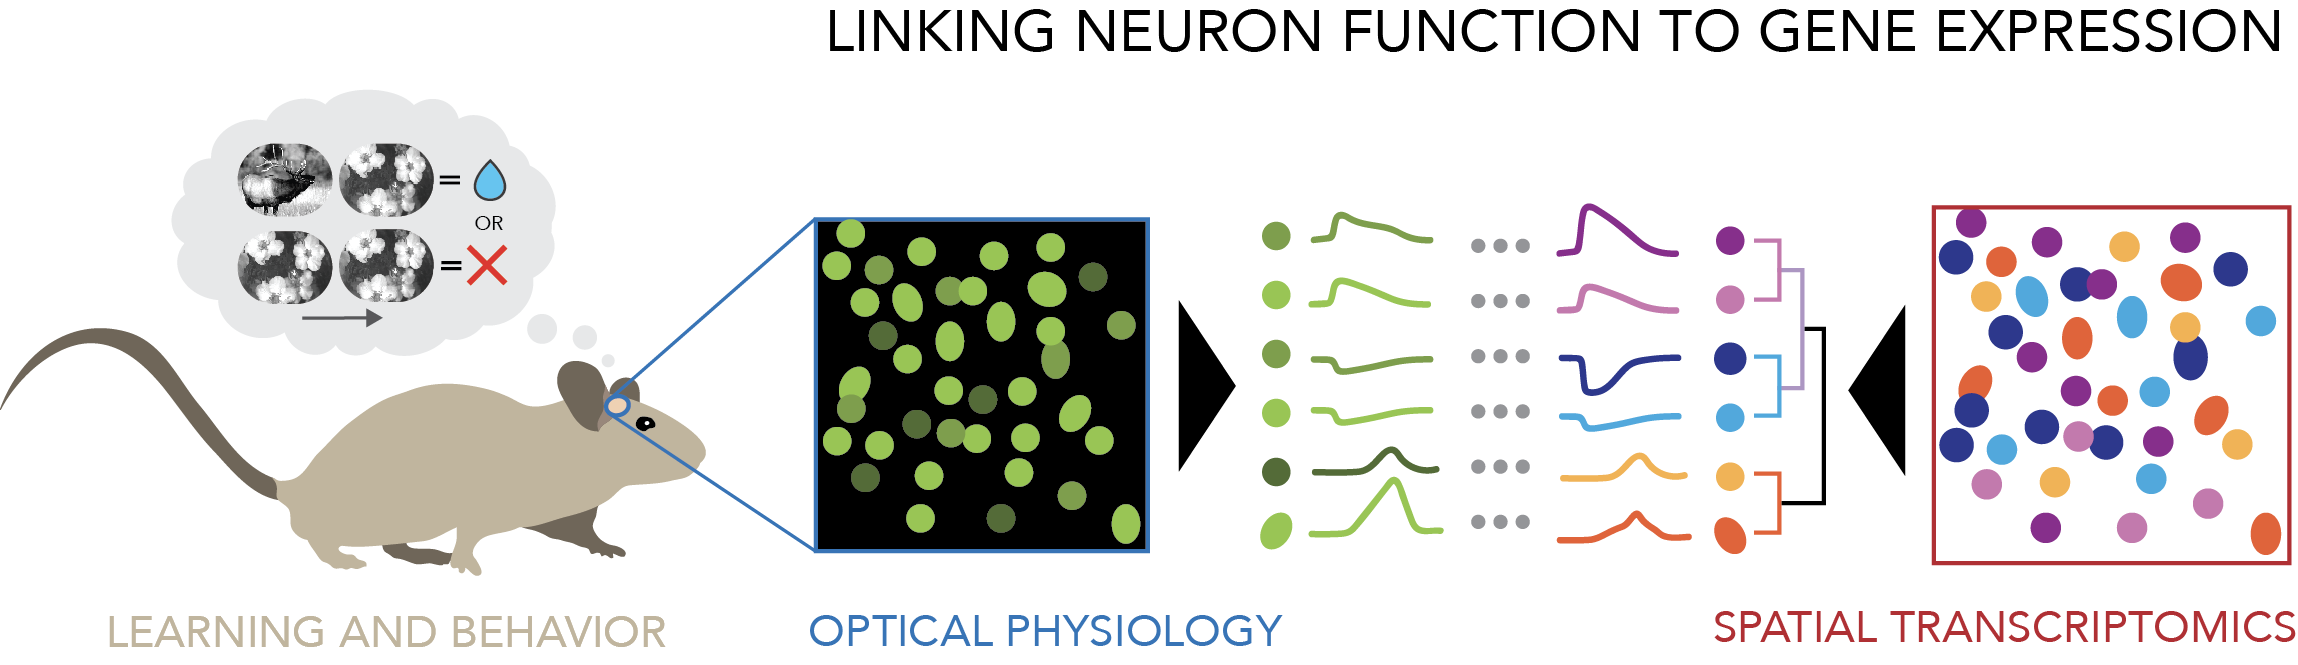
Fig. 17 Linking neuron function to gene expression#
The purpose of this dataset is to link what a neuron does to who a neuron is. We address this challenge specifically for the case of cortical inhibitory neurons. Inhibitory neurons are not a single population — they comprise several molecularly distinct subclasses with different connectivity, different intrinsic properties, and different roles in cortical computation: PV neurons , SST neurons , VIP neurons , LAMP5 neurons . Measuring the activity of these subclasses during learning has historically required choosing one subclass in advance, labeling it genetically, and recording it in isolation. Here, all inhibitory neurons are labeled at once, recorded together in the same field of view, and assigned to a subclass afterward on the basis of the genes they express. This makes it possible to ask how molecularly defined inhibitory subclasses differ in what they encode, how they interact with one another, and how those relationships change as an animal learns.
The dataset currently includes 147 imaging sessions from 6 mice, recorded across 8 imaging planes per session in primary visual cortex, along with measurements of behavior and task performance in every session. Gene expression data for 22 or 27 genes, depending on the mouse, is provided for neurons that were co-registered to post-hoc spatial transcriptomics.
Data descriptions#
The Visual Learning Ophys page describes the methods for longitudinal imaging during learning.
The task is the change detection task shared across the Visual Behavior datasets and is described on the Visual Behavior Task page. The Visual Learning dataset utilizes the same training procedure, with a few key differences - the learning paradigm and session types are described in Visual Learning Task .
The gene expression measurements are described in Visual Learning Transcriptomics , and the procedure that links the across modalities is described in Linking Ophys and Transcriptomics .
Tutorials#
The pages below demonstrate how to load and interact with the data, and how to link across modalities.
Session metadata comes first, because every analysis begins by choosing sessions. It queries the AIND document database for the metadata on each mouse and each acquisition, builds the one-row-per-session table the other notebooks read, and shows how to read the per-plane QC for z-drift.
The ophys and behavior NWB files is a reference for a single ophys session file. It opens one NWB file and walks through every container in turn — the five representations of neural activity, the running and lick data, the stimulus and trial tables, and the session metadata — explaining what each holds, how the per-plane clocks relate to one another, and how to put everything on a single timeline. Its final section compares what each session type looks like in the data.
Inhibitory cell types and physiology demonstrates the linkage between ophys and mFISH. It attaches the gene expression data and inhibitory subclass labels to the recorded neurons, covering the three ID systems involved, the join between the coregistration tables and the expression data, and comparisons of activity across inhibitory subclasses in familiar, novel, and cross-session analyses.
Aligning activity to visual events builds the event-alignment machinery the later analyses depend on. It extracts calcium traces around image changes, image omissions, and repeated presentations of each stimulus, working first in a gratings session then a natural image session with omissions.
Comparing the same neurons across sessions uses the longitudinal structure of the dataset directly. It loads a novel session and an extinction session that share the same image set, finds the neurons present in both, and compares how those neurons respond across the two days, sorted by inhibitory subclass.