
EM Connectomics#

Fig. 13 A rendering of cells in the MICrONs dataset, colored by cortical layer subtype.#
Electron Microscopy approach to Connectomics#
The function of the nervous system arises out of a combination of the properties of individual neurons and the properties of how they are connected into a larger network. The central goal of connectomics is to produce complete maps of the connectivity of the nervous system with synaptic resolution and analyze them to better understand the organization, development, and function of the nervous system. Electron microscopy (EM) has been a central tool in achieving these aims for two key reasons:
EM can easily image nanometer-scale structures such as synapses. This allows one to unambiguously observe chemical synapses and know with certainty that two neurons are connected as part of a network.
Dense staining methods allow the complete observation of a of rich collection of cellular features, including membranes, nuclei, mitochondria, and much more. This allows the reconstruction of the complete morphology of cells
Imaging modalities can be combined, for example with in vivo 2-Photon imaging, to measure both the function and structure of these cells
Electron Microscopy methods#
The general approach to EM involves staining tissue with heavy metals and usingelectrons to imaging thin sections of tissue. Sections can either be created by cutting tissue into slices (“serial section”) followed by imaging, or by imaging the face of a block and shaving off a thin layer of tissue after each run (“block face”). In both approaches, each section corresponds to only 30–50 nanometers of thickness (although it can be a millimeter wide), and thus assembling a substantial volumes involves thousands or tens of thousands of sections in a row. Finally, computational methods are used to align and assemble the sections into a single volume and then to segment the volume into individual cells and synapses.

Fig. 14 Outline of the major sequential steps used to generate the MICrONS dataset. First, in vivo measurements of neuronal functional properties are acquired from a region of interest (ROI) in the mouse visual cortex. In addition, a spatial overlapping in vivo structural image stack is collected to facilitate later registration with postmortem data. Following fixation of the brain, the tissue encompassing the functional ROI is processed for histology and sectioned. These sections are then imaged by TEM, and the resulting images are assembled into a 3D volume. Automated methods subsequently reconstruct the cellular processes and synapses within this volume, and the automated reconstructions are proofread as needed to ensure accuracy for further analysis. From “Functional connectomics spanning multiple areas of mouse visual cortex,” Nature 2025.#
While the resolution afforded by EM has been used to study the nervous system since 1959, the first true “connectomics” project that merged dense mapping of neurons and synaptic connectivity was the study of the nematode C. elegans led by Sydney Brenner, John White, and others. Advances in EM methods and computational methods in the last ten years have allowed tremendous scaling of connectomics datasets. The largest current mammalian datasets, including the MICrONs Cubic Millimeter volume and the V1 Deep Dive (V1DD) we will consider here, now span more than a cubic millimeter, and invertebrate datasets now can cover the entire brain of a fruit fly.
What questions can be addressed by connectomic data?#
For invertebrates like the fruit fly, the nervous system is highly stereotyped in both the composition of cells and how they connect to one another. Indeed, in the fly many cell types exist as a single pair of cells, one from the left and one from the right hemisphere. Connectomic maps from one individual can thus act as a nearly universal map of the brain and powerfully inform theoretical and experimental studies.
In mouse cortex, this same type of stereotypy does not apply. There is no one-to-one match between any given cell in the brain of one mouse and another, and thousands of cells in a cortical area can belong to the same cell type. Because of this, the types of questions one can ask differ, but dense reconstruction of anatomy and connectivity still can be a powerful source of insight into questions like:
What morphological or connectivity-based cell types can be found?
What are the properties of the excitatory networks in cortex and how might they relate to learning rules?
What rules dictate how inhibitory cells distribute their synaptic output across target cell types?
In both the MICrONS and V1DD dataset calcium imaging of the same tissue was performed prior to preparing the structural EM volume. In that case, we can address additional questions like:
How do functional responses relate to the morphology of cells?
How do functional responses relate to the connectivity of cells?
How does visual coding arise from population coding?
In addition, a whole host of non-neuronal cells are also present, such as astrocytes, oligodendrocytes, microglia, and pericytes. Many people are interested in studying the relationship between these cells and neurons, and connectomic datasets can be a powerful tool to discovery this structural context.
What Datasets are available for this course#
This year we have two cubic millimeter EM datasets available to work with: MICrONS and V1DD
Read more about both datasets in the Anatomy->EM subsections
The MICrONS Dataset#
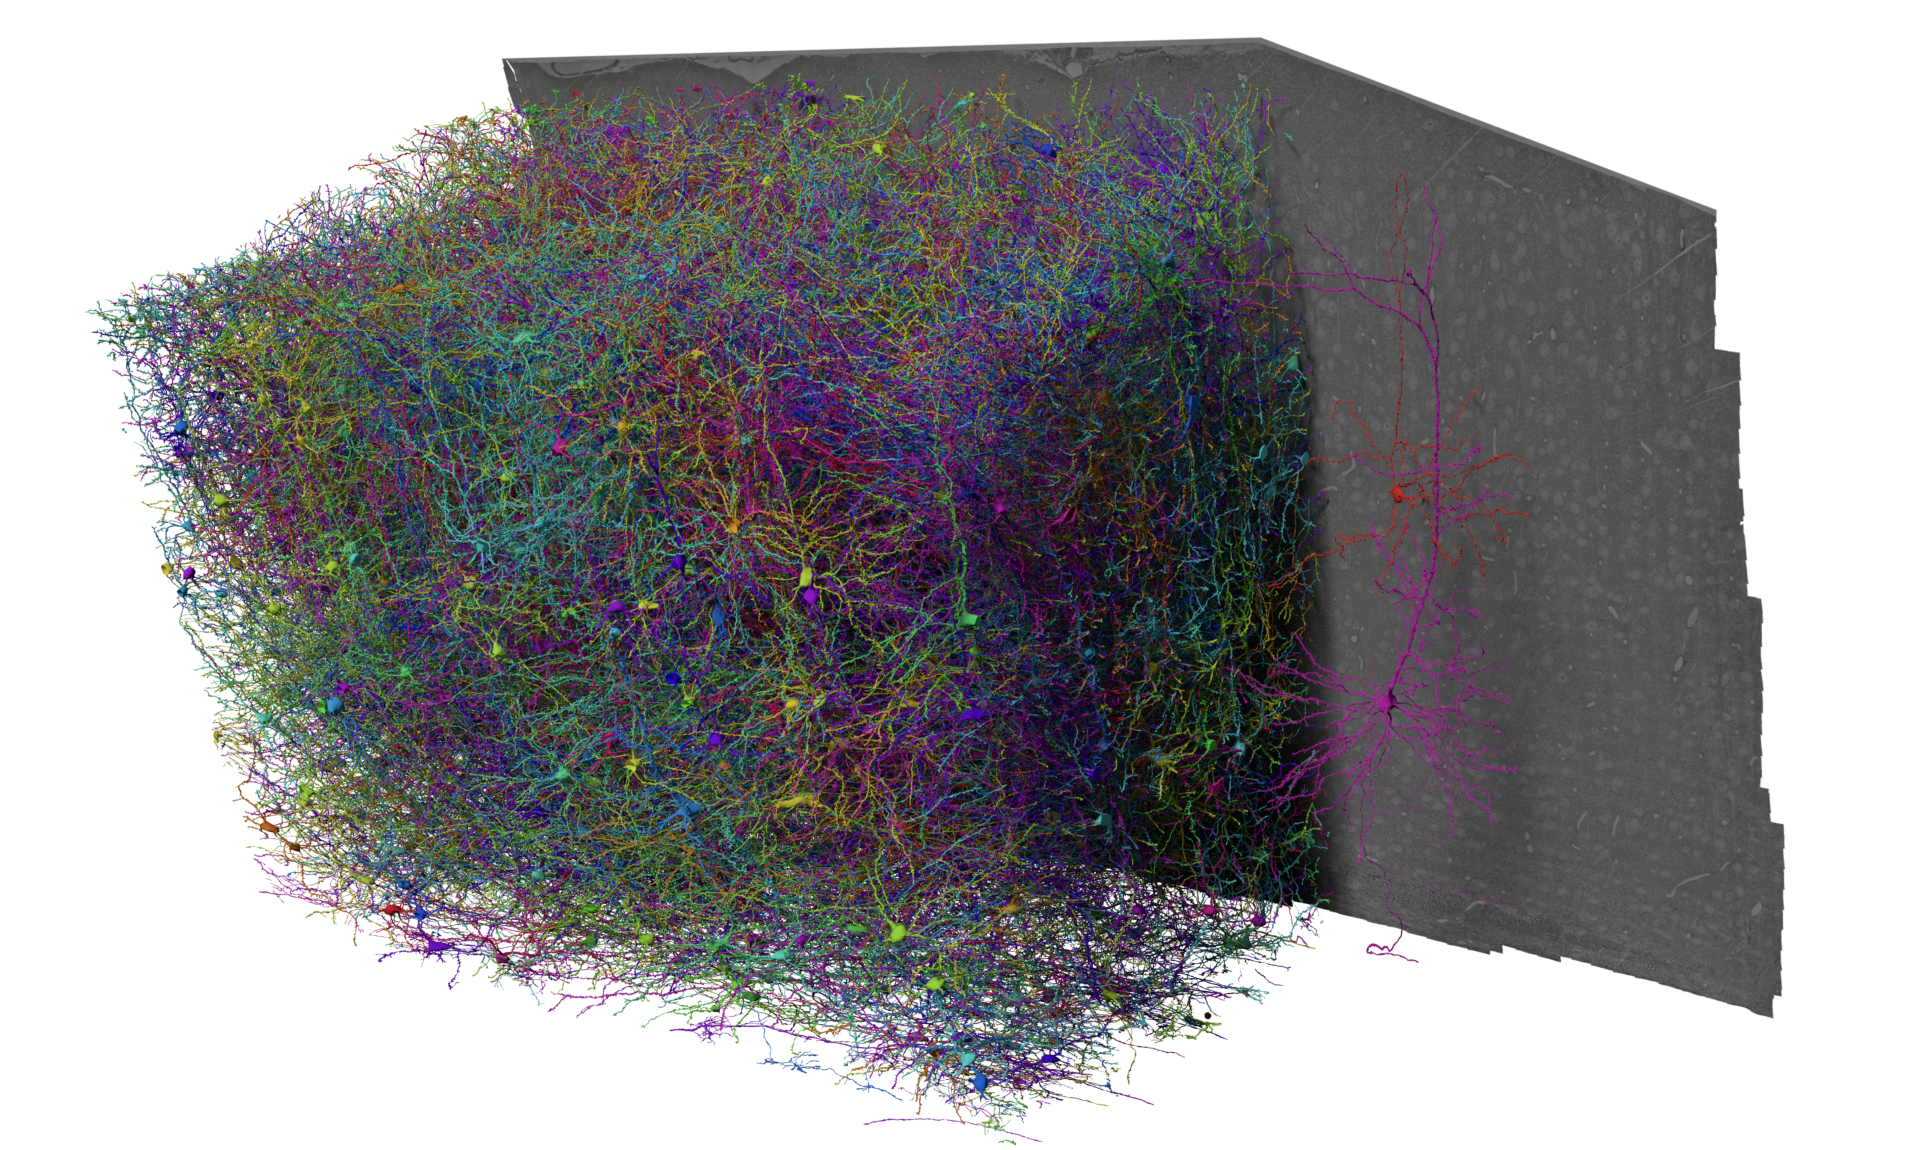
Fig. 15 The MICrONS Dataset, collected from 2018-2020, publicly available since 2021 but formally released April 2025#
The V1 Deep-Dive (V1DD)#

Fig. 16 The V1 Deep-Dive (V1DD) Dataset, collected and processed from 2019-2022, publicly available since August 2025#