
Visual Learning Ophys#
2-Photon calcium imaging during behavior#
Neural activity was measured as calcium fluorescence in mice expressing the
genetically encoded calcium indicator jGCaMP8s in inhibitory neurons,
using the transgenic line
Slc32a1-IRES-Cre;Oi1(TIT2L-jGCaMP8s-WPRE-ICL-IRES-tTA2) . Slc32a1 (VGAT) is
expressed by all GABAergic neurons, so the label is pan-inhibitory: PV, SST,
VIP, and LAMP5 neurons (see the glossary definitions for PV neuron ,
SST neuron and VIP neuron ) all express the indicator, and all
are recorded simultaneously in the same field of view. Excitatory neurons are
not labeled and are not present in this dataset.
This is a different strategy from datasets that use a subclass-specific Cre line
such as Vip-IRES-Cre or Sst-IRES-Cre . In those datasets the mouse line
determines the cell type, and each mouse yields one cell type. Here the mouse
line determines only that a neuron is inhibitory, and its subclass is
established after the in vivo experiment by measuring gene expression in the
same tissue. The consequence is that subclasses can be compared within a single
field of view, in the same session, under identical behavioral conditions — but
also that not every recorded neuron ends up with a subclass label, since a
neuron must be successfully matched to the transcriptomics data to receive one.
Another important difference from prior datasets, such as Visual Behavior and Visual Coding Ophys, is the use of GCaMP8s which is more sensitive and has better temporal resolution than previously used versions such as GCaMP6 (https://www.janelia.org/jgcamp8-calcium-indicators).
Sessions were acquired on a modified 2-photon Mesoscope, which records 8 imaging planes in a single session. All 8 planes are located in primary visual cortex (VISp), spanning 40–370 µm below the cortical surface across mice, corresponding roughly to layer 1 through upper layer 5. Each plane is sampled at approximately 10 Hz.
Sampling this depth range in VISp means layer 1 is included, which matters for inhibitory populations specifically: LAMP5 neurons, including neurogliaform cells , are concentrated in layer 1 and are largely absent from datasets that begin imaging deeper in the cortex.
In addition to fluorescence timeseries, running speed, lick times, and reward times were recorded throughout every session, allowing neural activity to be related to locomotion, task engagement, choices, and errors.
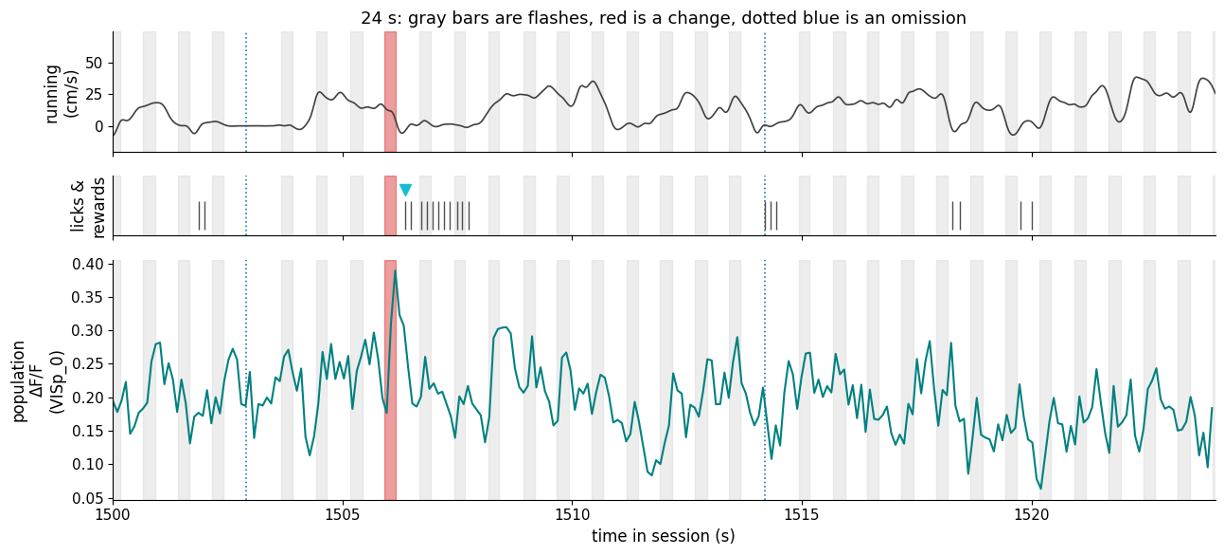
Fig. 25 Simultaneous measurement of in vivo physiology and behavior#
Tracking the same neurons across learning#
Each imaging plane is targeted repeatedly across days, so the same neurons can be followed across the training procedure. Cells are matched across sessions using ROICaT (https://roicat.readthedocs.io/en/latest/), an open-source tool for cross-session ROI matching, and matched cells receive an identifier that is stable across every session in which the cell was detected.
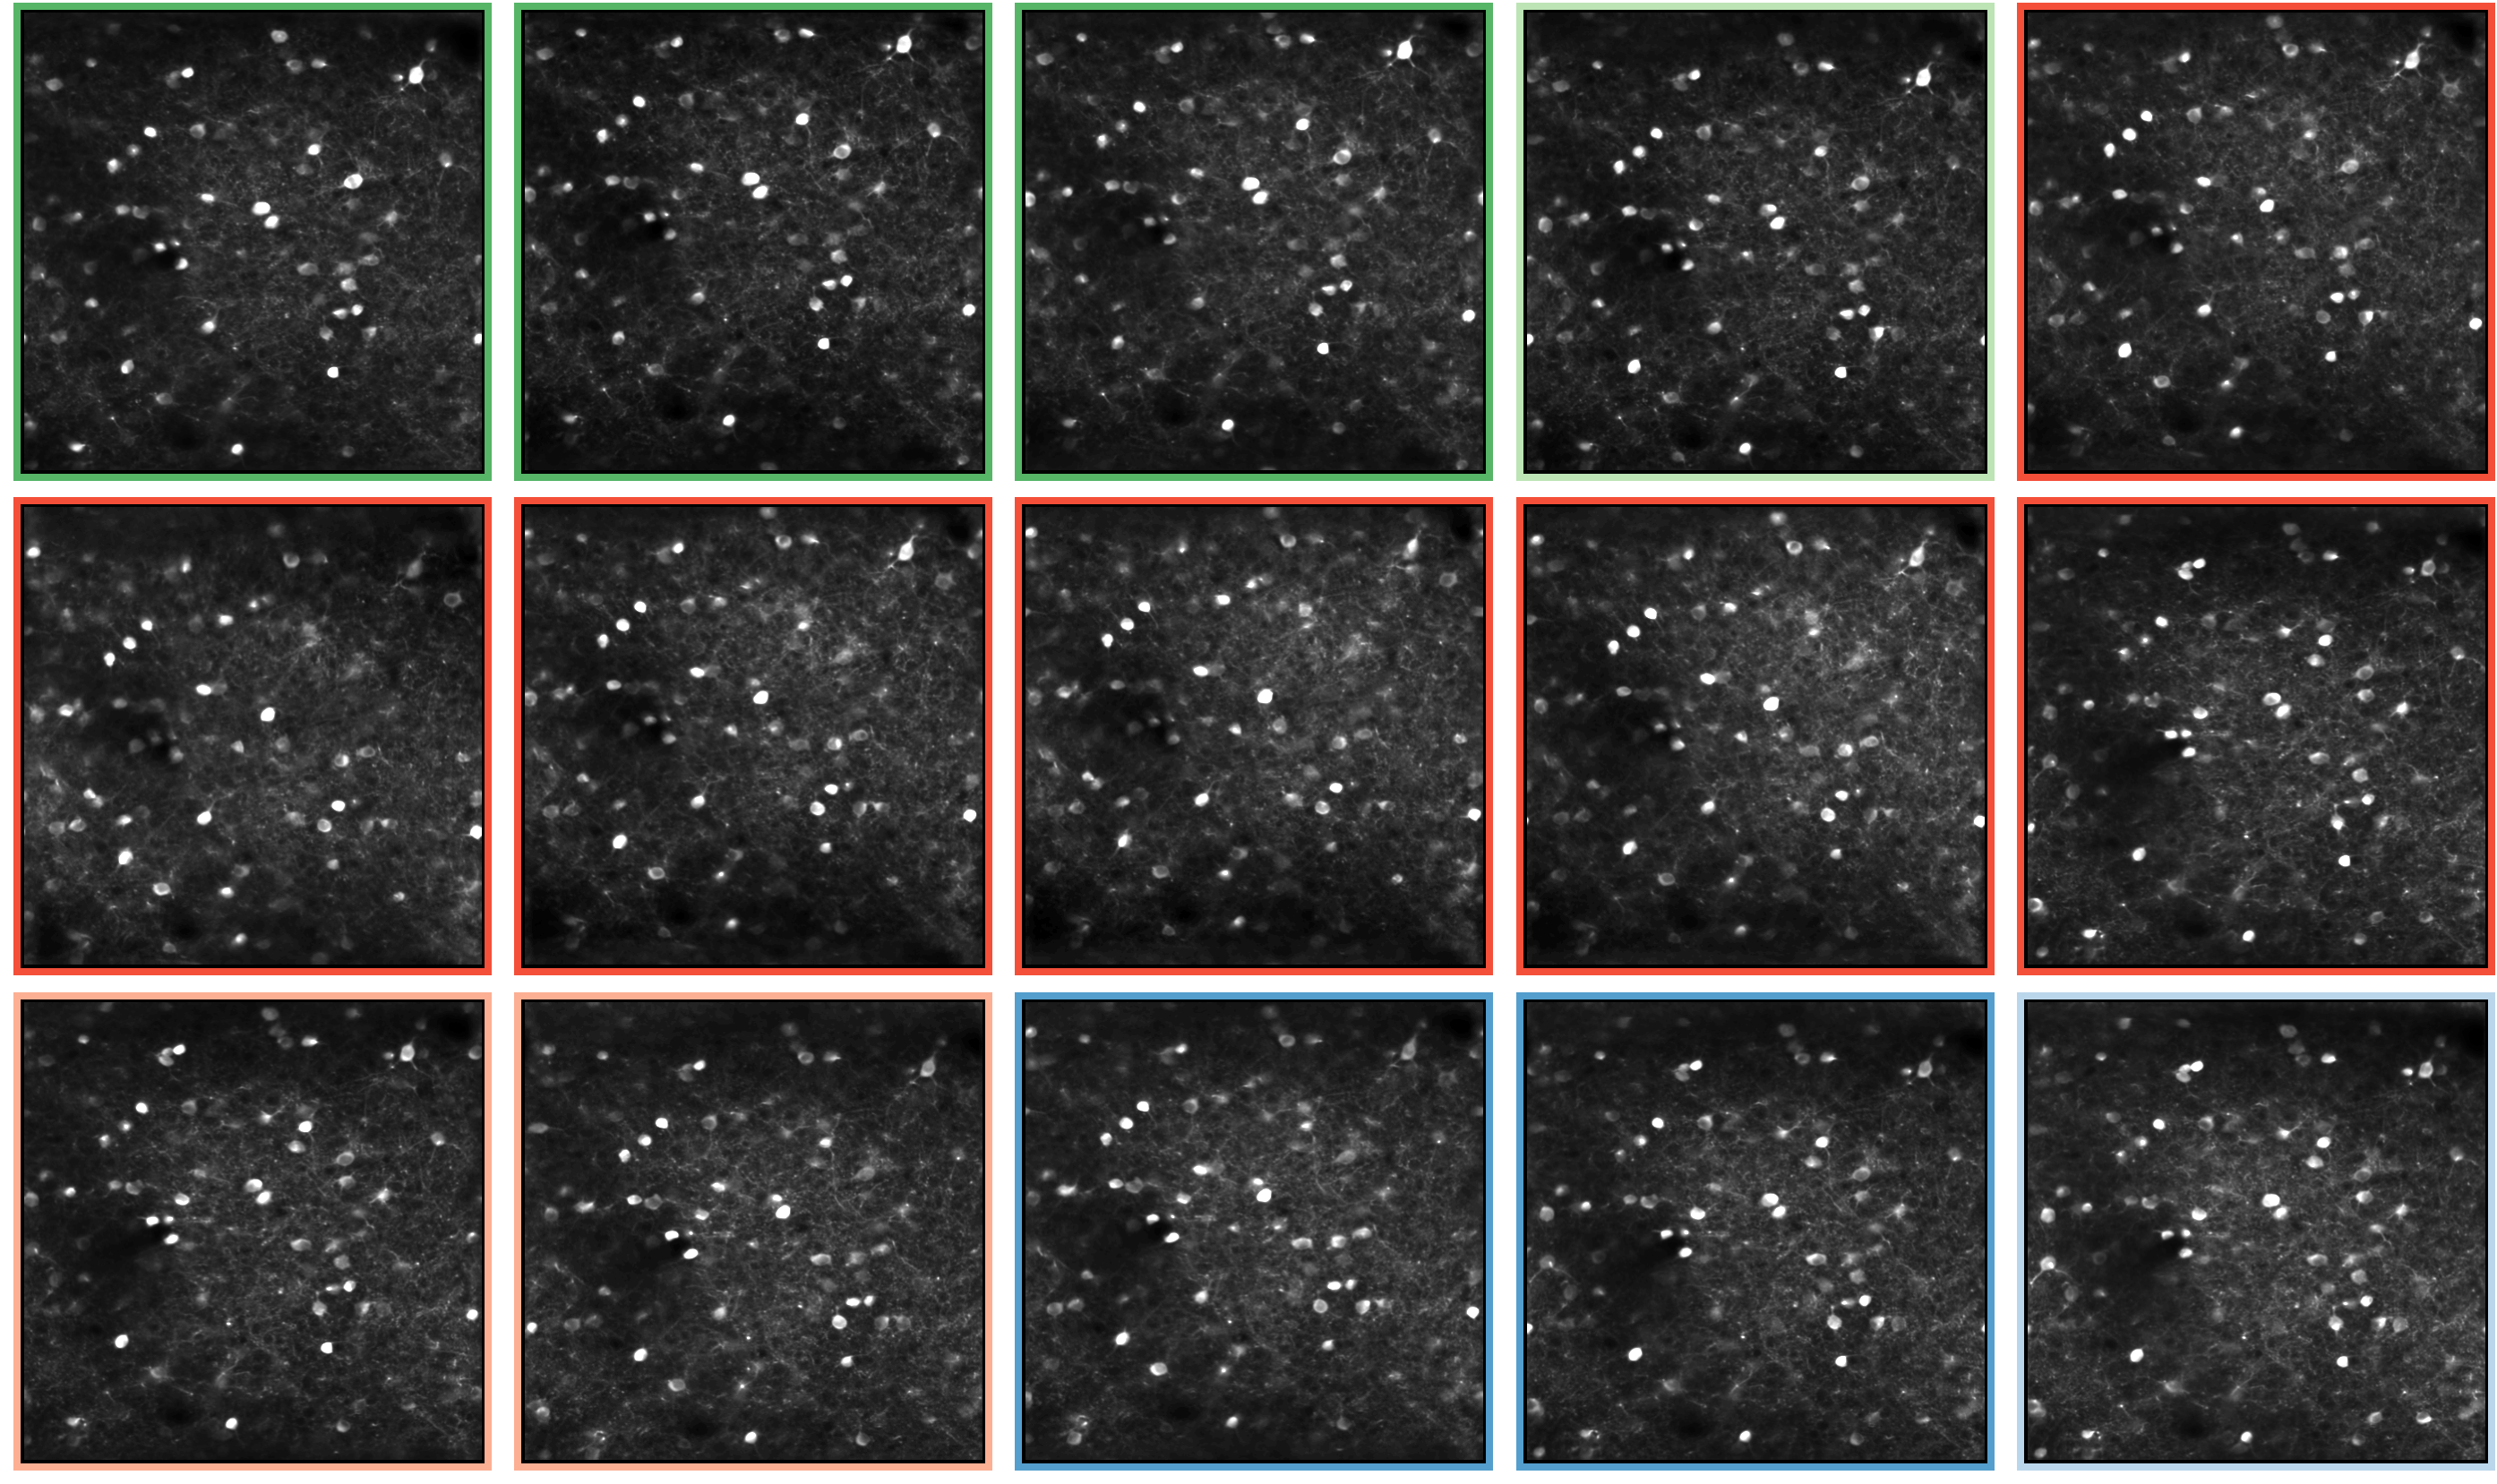
Fig. 26 The same field of view across sessions#
Not every neuron is matched in every session. A cell that is silent on a given day may not be segmented at all, segmentation can fail, and the imaging plane can drift in depth over the course of a session. The population that can be followed across the full sequence is therefore smaller than the population segmented in any single session.
Each recording is subject to stringent quality control (QC); accordingly, some imaging planes should not be used for analysis. The outcome of QC can be accessed in the metadata, which is described in Tutorial Session Metadata .
Relationship to the transcriptomics data#
After the in vivo experiments are complete, the brain is sectioned tangentially and probed for the expression of 22 or 27 genes, depending on the mouse, selected to distinguish inhibitory subclasses. You can learn more about the methods for spatial transcriptomics in the Visual Learning Transcriptomics page.
The resulting gene expression measurements are matched back to the neurons recorded in vivo. The registration procedure, the identifiers used to link the two datasets, and the numbers of neurons available at each stage are described in Linking Ophys and Transcriptomics .
Neurons that are successfully matched receive a subclass label — PV, SST, VIP, or LAMP5 — which can then be applied to their activity in any session in which they were recorded. Neural activity can also be related to the continuous gene expression patterns across all measured genes, rather than or in addition to grouping neurons by the subclass marker genes.
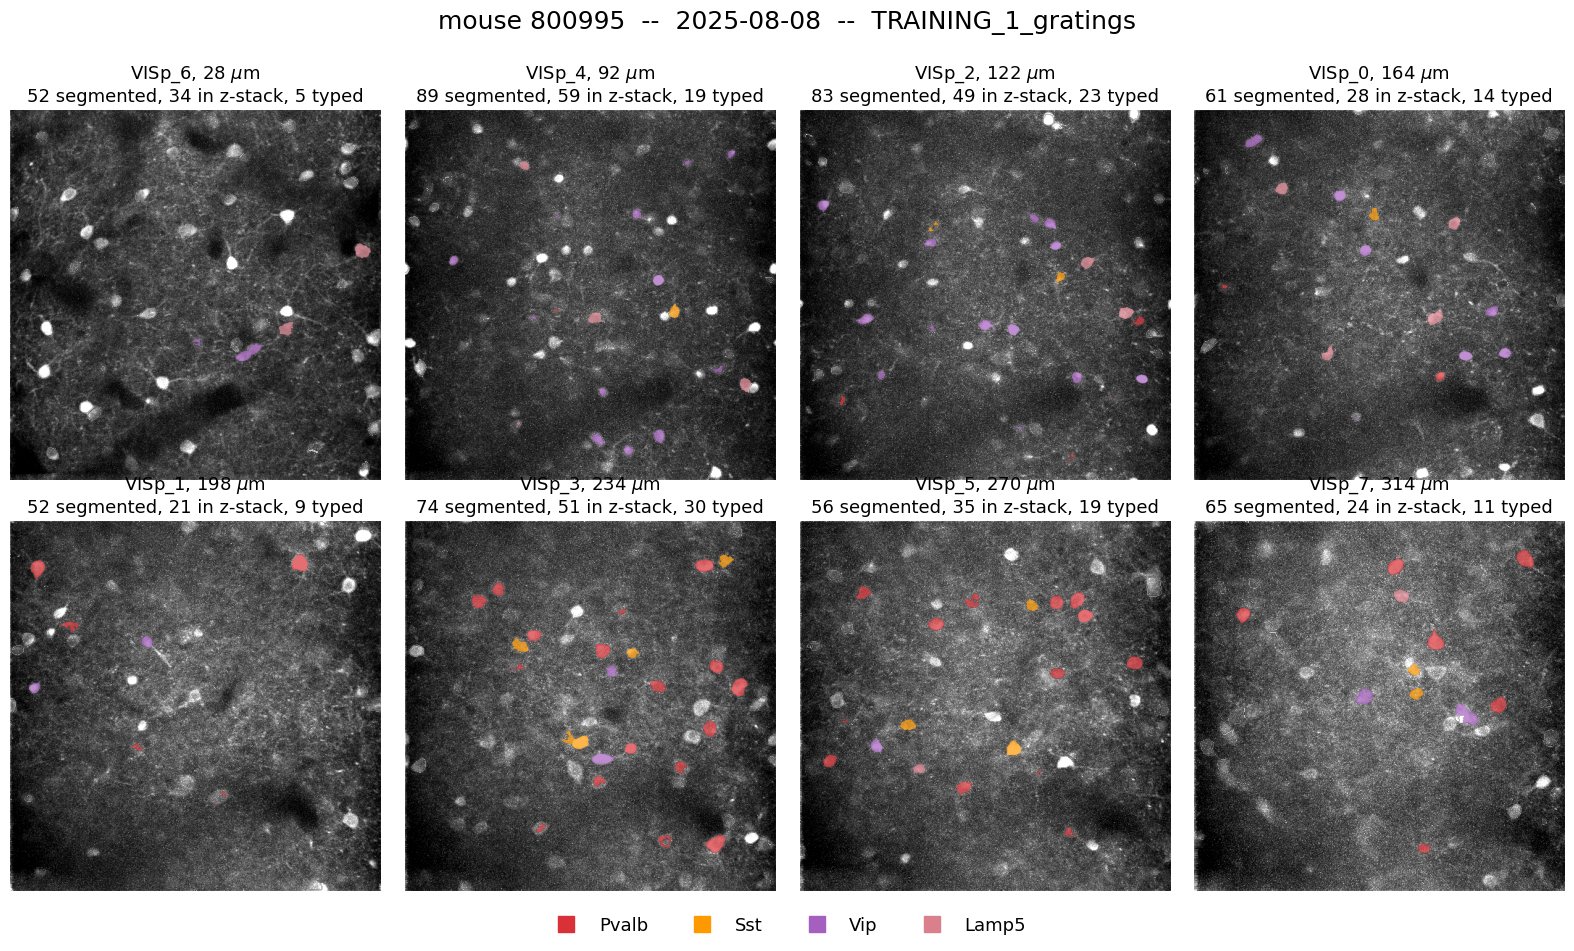
Fig. 27 Coregistered inhibitory neurons across imaging planes#
The number of neurons carrying a subclass label is smaller than the number segmented, since a neuron must be matched through several registration steps before it can be labeled. Subclass representation is also uneven: PV and VIP neurons are recovered in larger numbers than SST neurons, which is worth considering when planning comparisons between subclasses.
With subclass labels attached, activity during any session type can be compared across inhibitory subclasses.
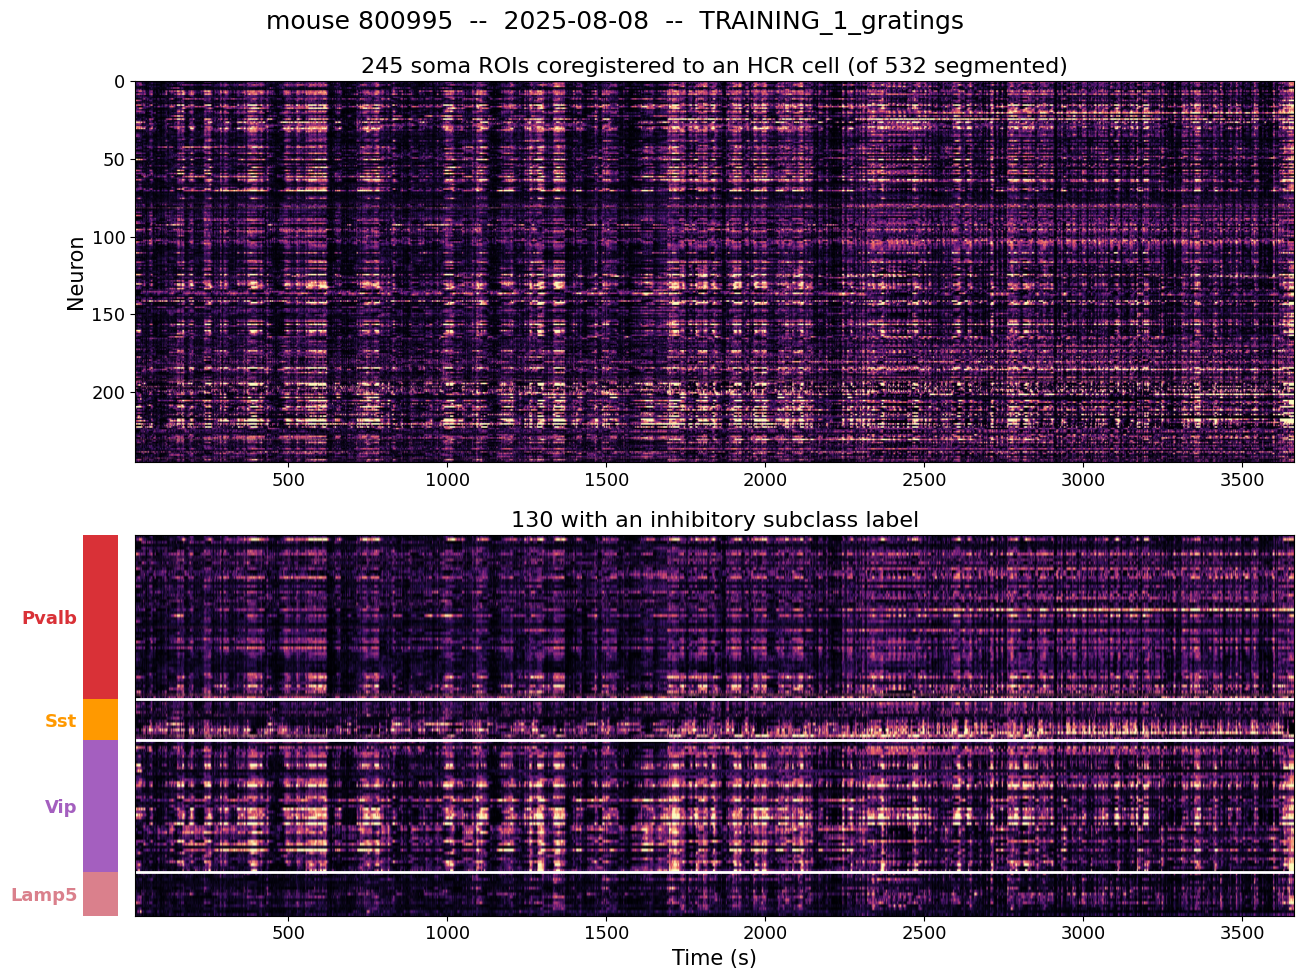
Fig. 28 Activity of coregistered neurons sorted by subclass#
Neural activity can also be related to the continuous gene expression patterns across all measured genes, rather than or in addition to grouping neurons by the subclass marker genes.