
MICrONS Functional Data#
The MICrONs mouse went through a battery of functional imaging experiments before be prepared for electron microscopy. Excitatory neurons were imaged with 2-photon calcium imaging using GCaMP6s. Because of the size of the volume, different populations of neurons were imaged in different sessions, spanning several days. Each neuronal ROI` from the functional data is uniquely determined based on the combination of image session, scan index, and ROI unit id. During each imaging session, the mouse was head-fixed and presented a variety of visual stimuli to the left visual field, including both natural movies and synthetic parametric movies. In addition to functional 2p imaging, the treadmill rotation, left eye position, and left pupil diameter were recorded to provide behavioral context.
Stimuli and “Digital twin”#
The visual stimuli presented to the mouse included many natural movies, as well as parametric stimuli that were designed to emphasize specific visual features, such as orientation and spatial frequency. Because imaging sessions were performed over several days and imaging time in any one location was limited, comparisons between cells in different sessions are not straightforward. To get around this, the principle goal of this collection of stimuli was to be used as training data for deep neural networks that were trained to predict the response of each cell to an arbitrary stimulus. These so-called “digital twins” were designed to be used to probe functional responses to cells to stimuli that were outside the original training set. More details about this digital twin approach can be found in (Wang et al. 2025) and (Ding et al. 2025).
As a measure of the reliability of visual responses, a collection of six movies totalling one minute were presented to the mouse ten times per imaging session. An oracle score was computed based on the signal correlation of a given cell to the oracle stimuli across the imaging session, where higher numbers indicate more reliable responses. Specifically, the oracle score is the mean signal correlation of the response of each presentation to the average of the other nine presentations.
Coregistration#
The process of aligning the location of cells from the functional imaging with the same cells in the EM imaging is called coregistration. It is a challenging problem due to the need for micron-scale alignment of image volumes, despite significant differences in the imaging modalities, tissue deformations under different conditions and potential distortions introduced by sample preparation.
The dataset contains two approaches to coregistration, one semi-manual and one fully automatic. In the semi-manual approach, a transform between the EM data and the 2p data was generated based on fiducial points such as blood vessels and cell bodies. This transform was then applied to the functional data to identify a location in the EM space, and a human annotator then identified the cell body in the EM data that was a best match to the functional ROI based on location and context. In the fully automatic approach, blood vessels were segmented in both 2p and EM volumes, and a transform was generated based on matching this 3d structure. More details can be found in the MICrONS dataset flagship.
Coregistration Quality Metrics#
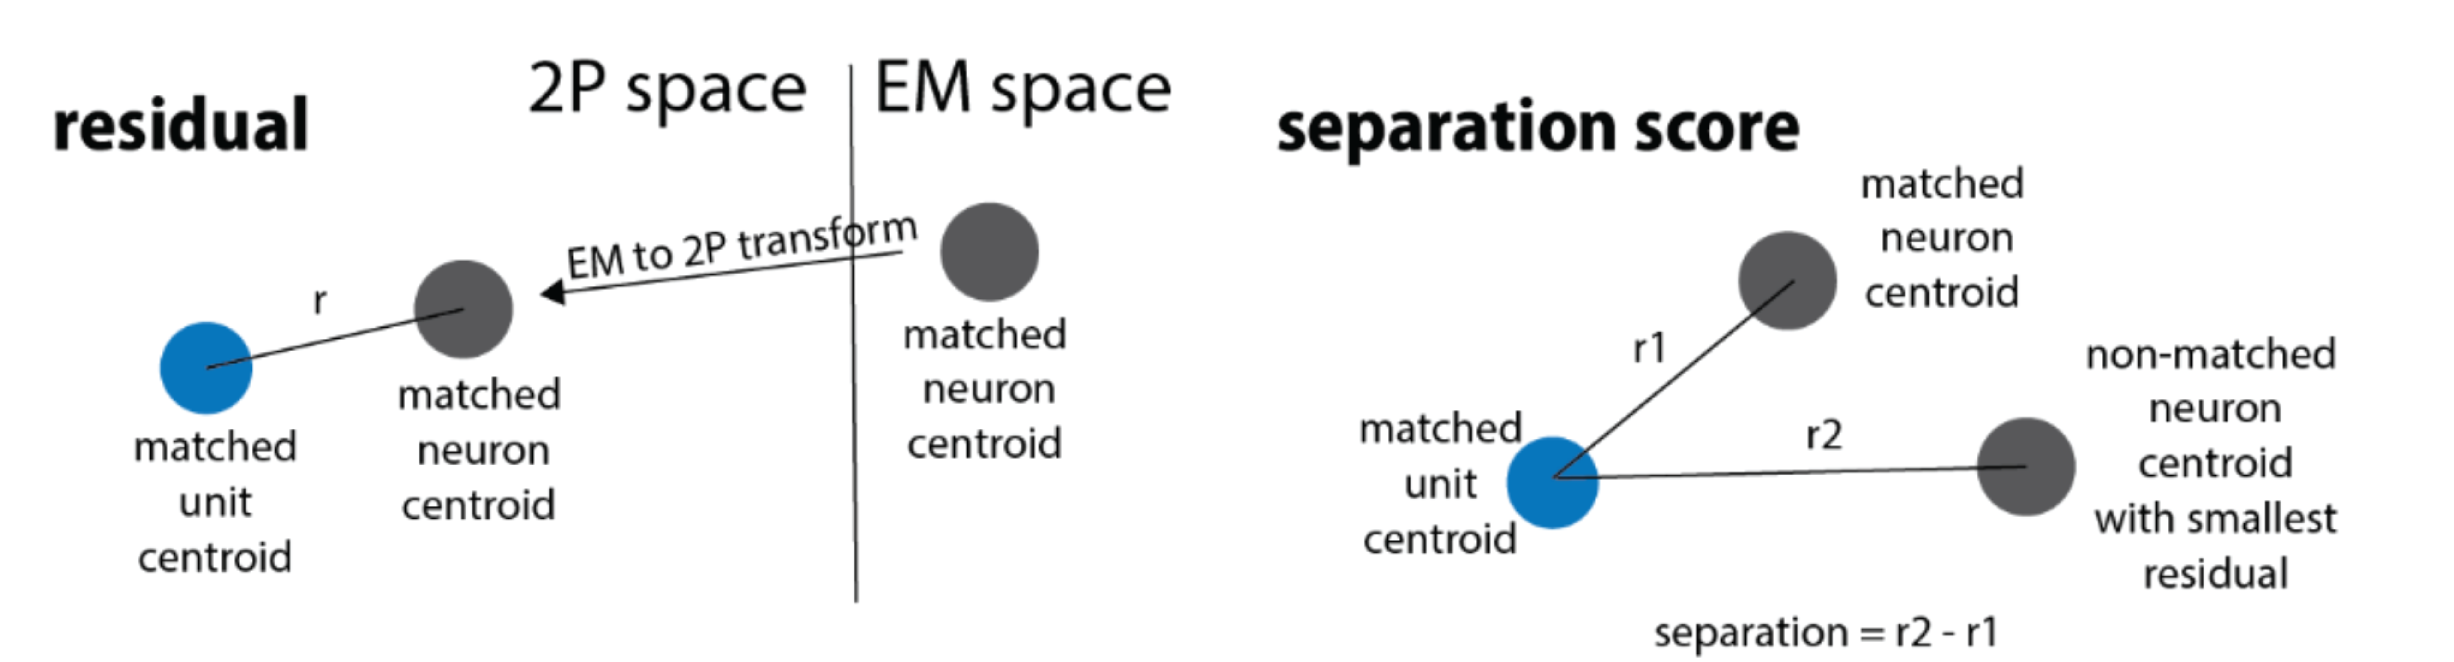
Fig. 54 Cartoon illustrating the coregistration metrics.#
Two values are available to help assess the quality of the coregistration. The residual indicates the distance between the location of an ROI after transformation to the EM space and the location of the matched cell body in the EM data. The score (or separation score) is the distance between the matched cell body and the nearest other cell body in the EM data. This attempts to measure how the residual compares with the distance to other potential matches in the data. Larger values indicate fewer potential matches and therefore a more confident match, in general.
When using the automated coregistration, it is important to filter the data based on assignment confidence. A guide for this can be found by comparing the subset of cells matched by both the automated and manual coregistration methods.
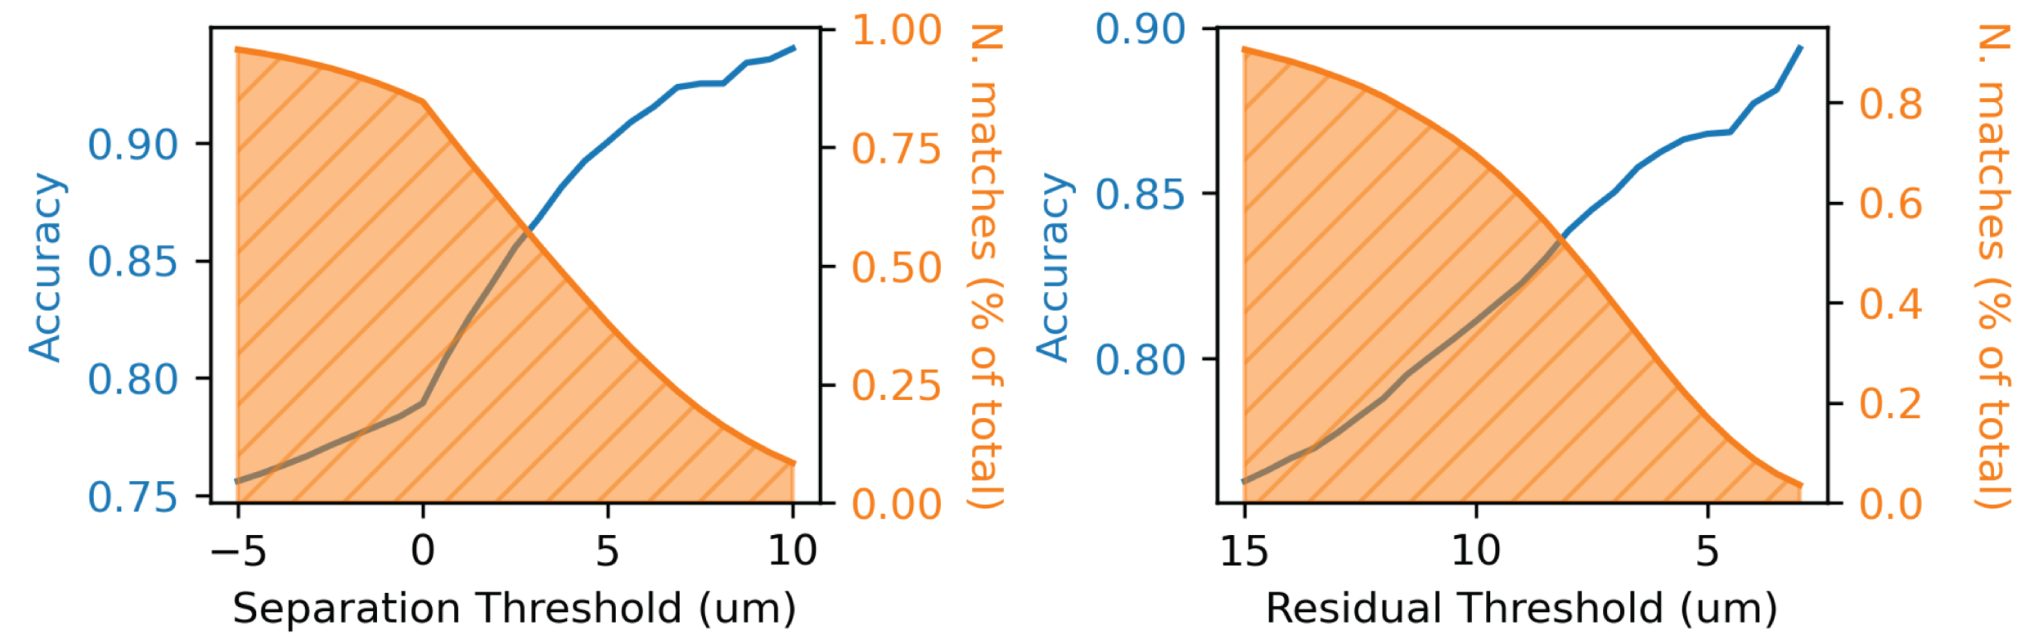
Fig. 55 Relationship between separation threshold (left) and residual (right) and the accuracy of automated coregistration compared to manual coregistration. Orange curves depict the fraction of cells that remain after filtering out those matches beyond the threshold indicated on the x-axis.#
Matching EM to Function#
The combination of session index, scan index, and ROI unit id uniquely identifies each ROI in the functional data.
The annotation database contains tables with the results of each of the coregistration methods.
Each row in each table contains the nucleus id, centroid, and root ID of an EM cell as well as the scan/session/unit indices required to match it.
In addition, the residual and score metrics for each match are provided to filter by quality.
For manual coregistration, the table is called coregistration_manual_v4 and for automated coregistration, the table is called coregistration_auto_phase3_fwd_apl_vess_combined_v2.
Full column definitions can be found on Annotation Tables page.
Functional data#
Flourescence, activity, and behavior#
Has been extracted from the DataJoint database and is available as a Code Ocean asset as a set of xarray files. Ask your TA how to access and interpret the functional data.
Derived properties of coregistered neurons#
A summary of the functional properties for are stored in three Coregistration Annotation Tables tables with the same columns:
digital_twin_properties_bcm_coreg_v4which is mapped tocoregistration_manual_v4This table is well-verified, but contains fewerROIs (N=15,352 root ids, 19,181 ROIs).
digital_twin_properties_bcm_coreg_auto_phase3_fwd_v2anddigital_twin_properties_bcm_coreg_apl_vess_fwdwhich is mapped to the corresponding automatic coregistration methods. These tables are not manually verified, but contains moreROIs
The key columns are:
Column |
Description |
|---|---|
|
Test set performance of the digital twin model unit, higher is better |
|
Neuron variability score used to normalize digital twin model unit performance |
|
Normalized model unit performance, higher is better |
|
orientation selectivity index |
|
direction selectivity index |
|
global orientation selectivity index |
|
global direction selectivity index |
|
Preferred orientation in degrees (0 - 180), vertical bar moving right is 0 and orientation increases counter-clockwise |
|
Preferred direction in degrees (0 - 360), vertical bar moving right is 0 and orientation increases counter-clockwise |
|
X coordinate of the readout location, an approximation of receptive field center in stimulus space; (-1, -1) bottom-left, (1, 1) top-right |
|
Y coordinate of the readout location, an approximation of receptive field center in stimulus space; (-1, -1) bottom-left, (1, 1) top-right |