
Visual Coding — Neuropixels#
The Visual Coding – Neuropixels project uses high-density extracellular electrophysiology (Ecephys) probes to record spikes from a wide variety of regions in the mouse brain. Our experiments are designed to study the activity of the visual cortex and thalamus in the context of passive visual stimulation as is described in Siegle et al. [2021], but these data can be used to address a wide variety of topics.
Spike-sorted data and metadata are available as Neurodata Without Borders (NWB) files.
For detailed information about the experimental design, data acquisition, and informatics methods, please refer to our technical whitepaper.
Note
A note on terminology: Throughout the tutorials, we refer to neurons as units, because we cannot guarantee that all the spikes assigned to one unit actually originate from a single cell. Unlike in two-photon imaging, where you can visualize each neuron throughout the entire experiment, with electrophysiology we can only “see” a neuron when it fires a spike. If a neuron moves relative to the probe, or if the neuron is far away from the probe, some of its spikes may get mixed together with those from other neurons. Because of this inherent ambiguity, we provide a variety of quality metrics to allow you to find the right units for your analysis. Even highly contaminated units contain potentially valuable information about brain states, so they are still included within the dataset. However, certain types of analysis require more stringent quality thresholds to ensure that all of the included units are well isolated from their neighbors.
Data processing#
See the section on Neuropixels data processing.
Session types#
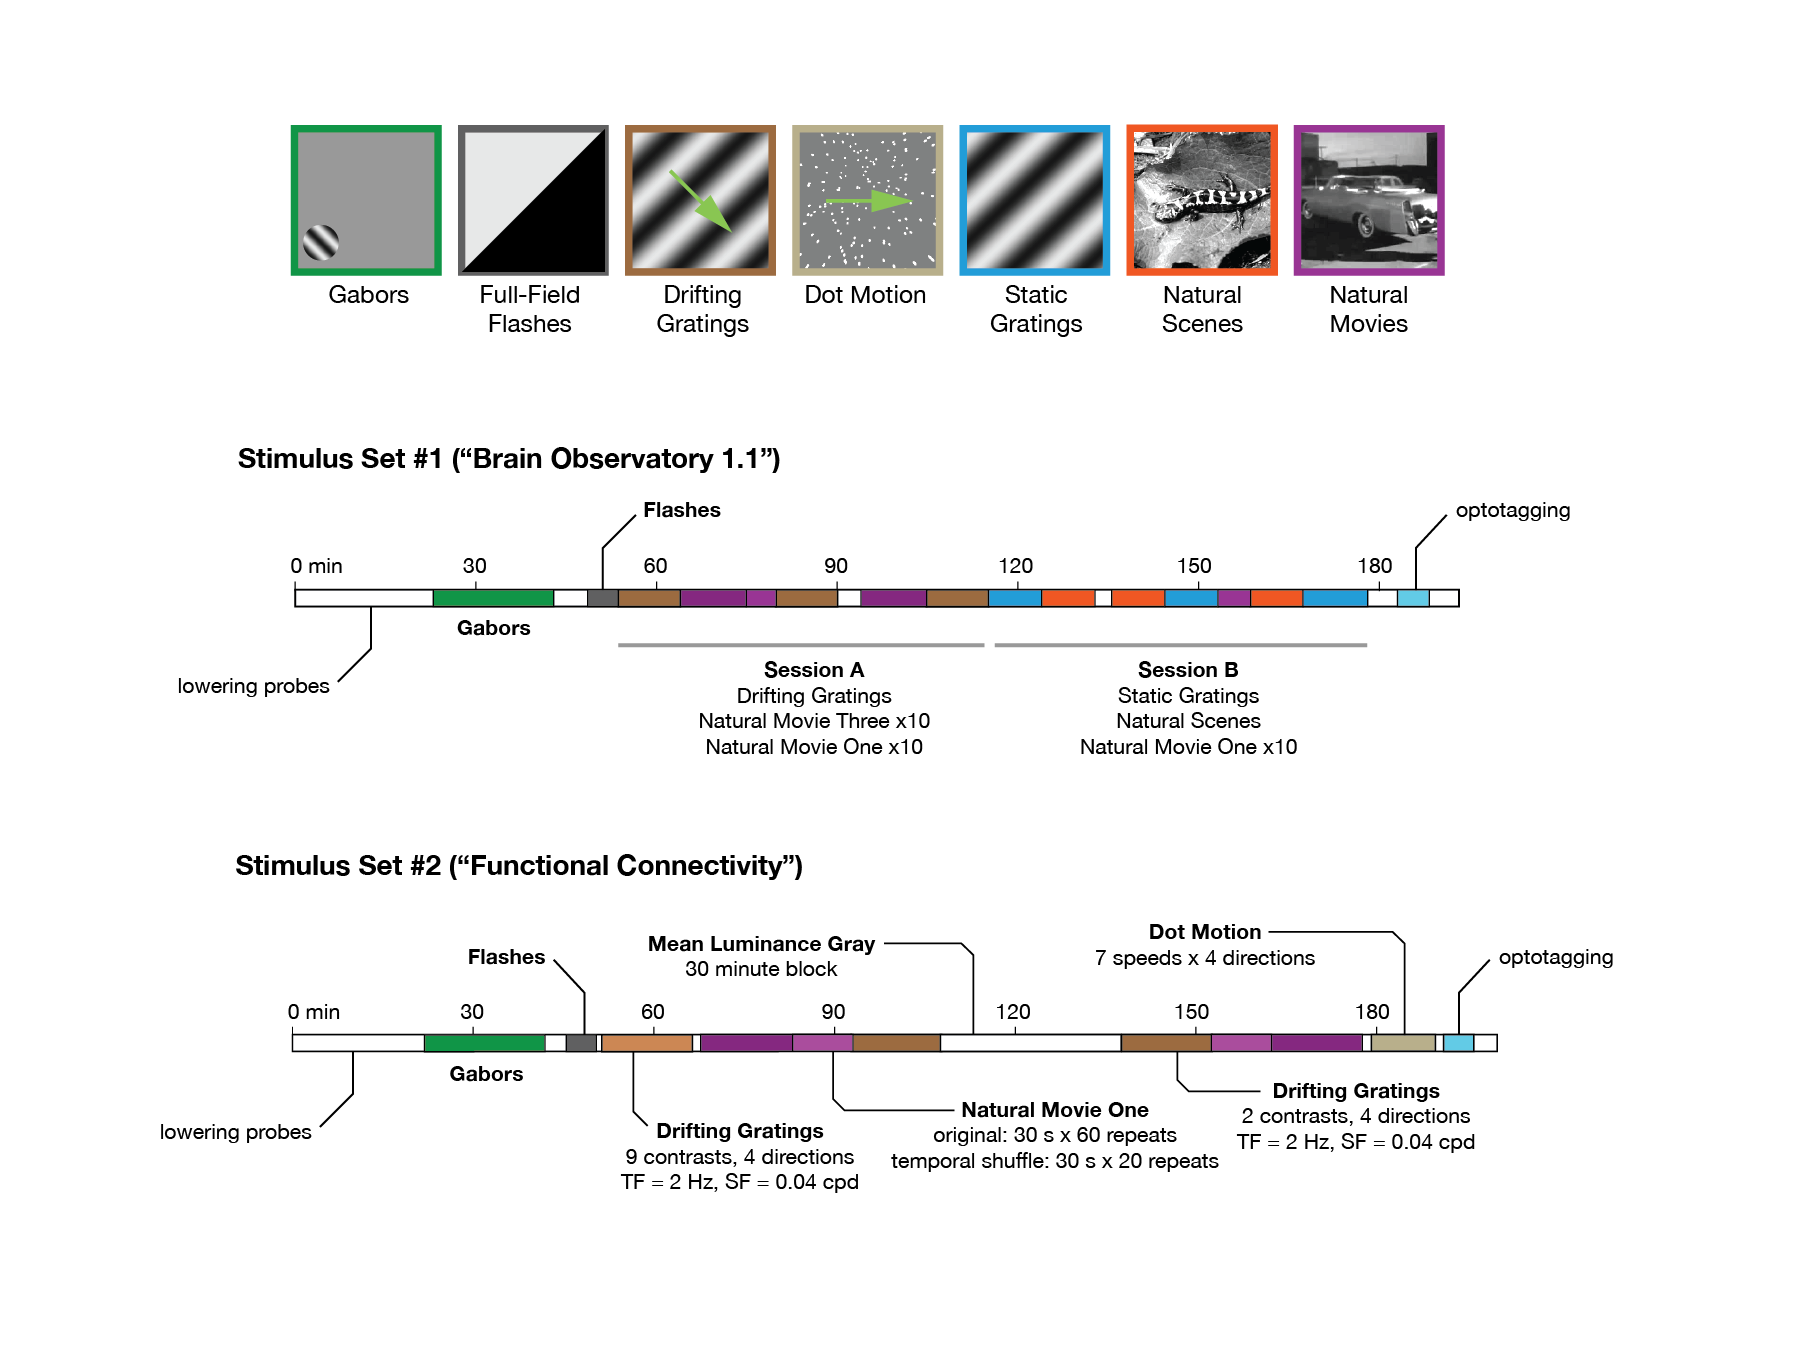
Fig. 34 Neuropixels visual stimulus sets#
A central aim of the Visual Coding – Neuropixels project is to measure the impact of visual stimuli on neurons throughout the mouse visual system. To that end, all mice viewed one of two possible session types, known as Brain Observatory 1.1 or Functional Connectivity. Both session types began with a Gabor stimulus flashed at 81 different locations on the screen, used to map receptive fields of visually responsive units. Next, the mice were shown brief flashes of light or dark, to measure the temporal dynamics of the visual response.
The remainder of the visual stimulus set either consisted some of the stimuli shown in the ophys experiments (Brain Observatory 1.1), or a set of variants of those stimuli shown with different sets of parameters in addition to a dot motion stimulus, to measure the speed tuning of units across the mouse visual system (Functional Connectivity).
Both session types end with an opotagging epoch.
Quality metrics#
Every NWB file includes a table of quality metrics, which can be used to assess
the completeness, contamination, and stability of units in the recording. By
default, we won’t show you units below a pre-determined quality threshold; we
hide any units that are not present for the whole session
(presence_ratio < 0.95), that include many contaminating spikes
(isi_violations > 0.5), or are likely missing a large fraction of spikes
(amplitude_cutoff > 0.1). However, even contaminated or incomplete units contain
information about brain states, and may be of interest to analyze. Therefore,
the complete units table can be accessed via special flags in the AllenSDK.
In general, we do not make a distinction between ‘single-unit’ and ‘multi-unit’
activity. There is no obvious place to draw a boundary in the overall
distributions of quality metrics, and setting a strict cutoff (e.g.
isi_violations = 0) will remove a lot of potentially valuable data. We prefer to
leave it up to the end user to decide what level of contamination is tolerable.
But that means you need to be aware that different units will have different
levels of cleanliness.
It should also be noted that all of these metrics assume that the spike waveform is stable throughout the experiment. Given that the probe drifts, on average, about 40 μm over the course of the ~3 hour recordings, this assumption is almost never valid. The resulting changes in waveform shape can cause a unit’s quality to fluctuate. If you’re unsure about a unit’s quality, it can be helpful to plot its spike amplitudes over time. This can make it obvious if it’s drifting below threshold, or if it contains spikes from multiple neurons.
Documentation on the various quality metrics can be found in the ecephys_spike_sorting repository.