
Neuroglancer#
Note
Neuroglancer works best in Chrome and Firefox but does not always work as expected in Safari.
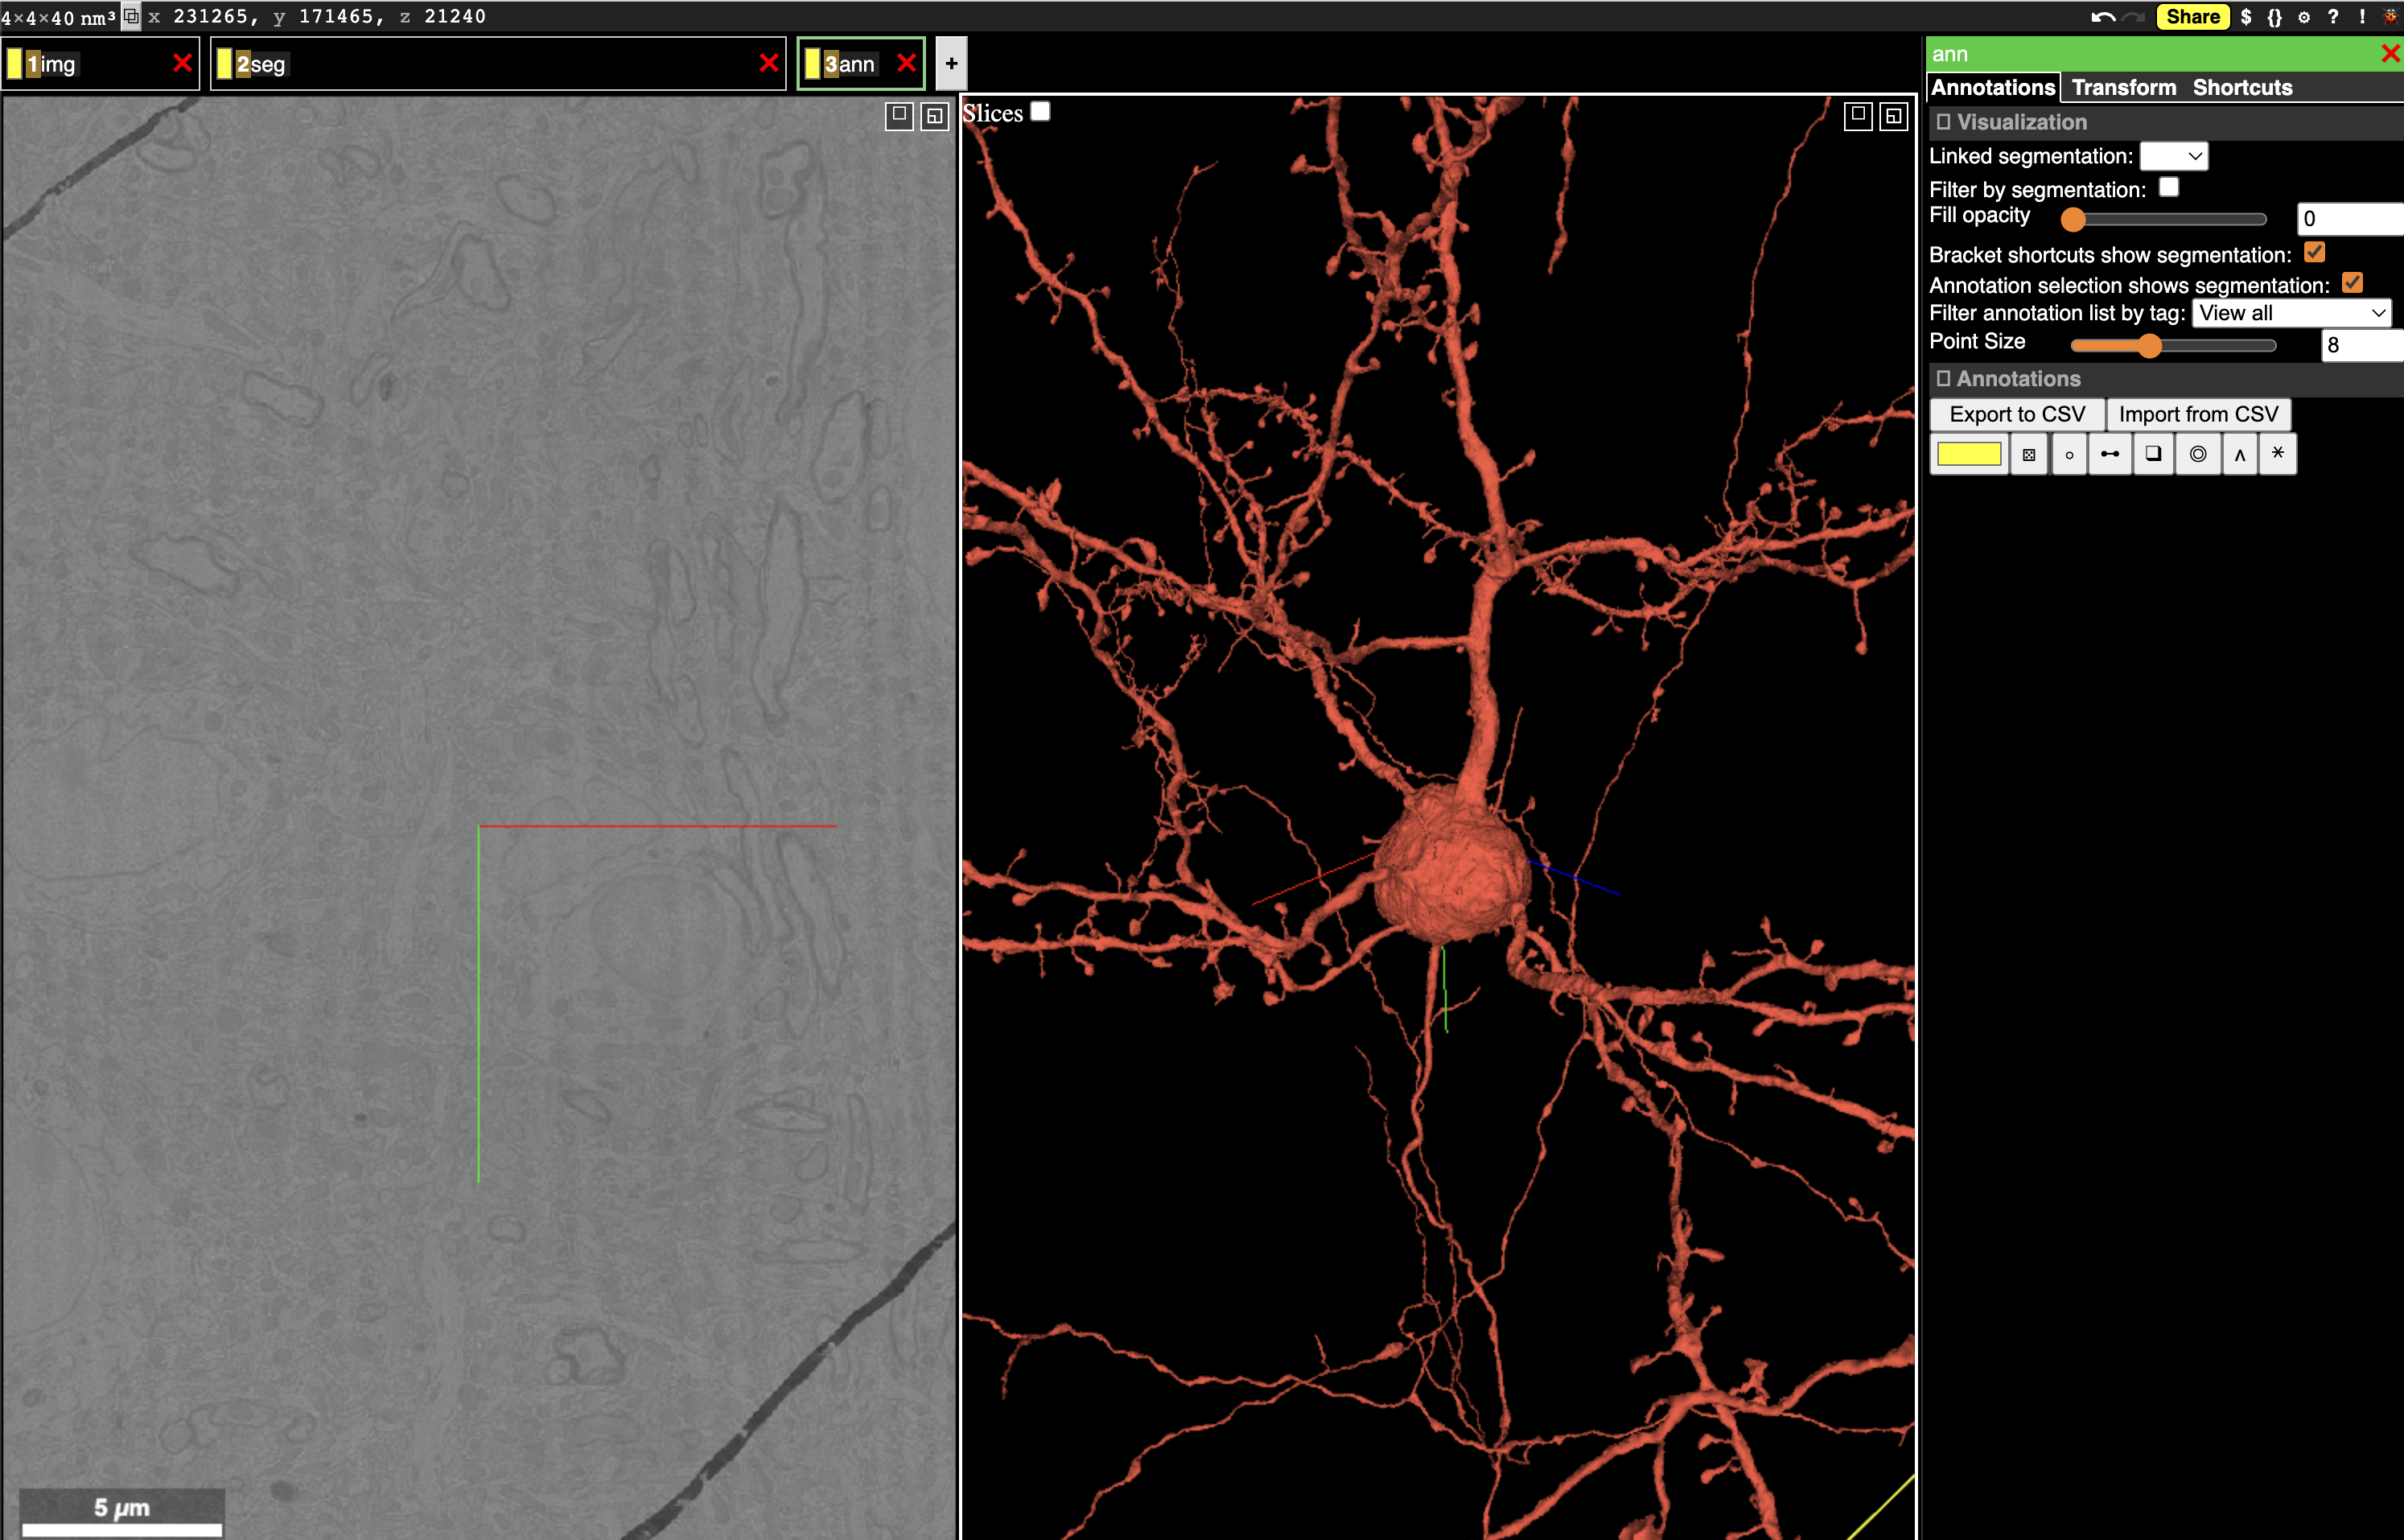
Fig. 28 Neuroglancer can show multiple layers of data, including imagery, segmentation, and more.#
Neuroglancer is a WebGL-based viewer developed by Jeremy Maitin-Shephard at the Google Connectomics team to visualize very large volumetric data, designed in large part for connectomics. We often use Neuroglancer to quickly explore data, visualize results in context, and share data.
To view MICrONS data in neuroglancer: MICrONS Neuroglancer
To view V1DD data in neuroglancer: V1DD Neuroglancer
Note that you will need to authenticate with the same Google-associated account that you use to set up CAVEclient.
For animated data access examples, see MICrONS Explorer Neuroglancer introduction
Dataset specificity#
The examples below are written with the MICrONS dataset. To access the V1DD dataset change the datastack from minnie65_public to v1dd_public
Interface Basics#
The Neuroglancer interface is divided into panels. In the default view, one panel shows the imagery in the X/Y plane (left), one shows a 3d view centered at the same location, and the narrow third panel provides information about the specific layer.
Note that at the center of the each panel is a collection of axis-aligned red, blue and, green lines. The intersection and direction of each of these lines is consistent across all panels.
Along the top left of the view, you can see tabs with different names. Neuroglancer organizes data into layers, where each layer tells Neuroglancer about a different aspect of the data. The default view has three layers:
imgdescribes how to render imagery.segdescribes how to render segmentation and meshes.annis a manual annotation layer, allowing the user to add annotations to the data.
You can switch between layers by right clicking on the layer tab. You will see the panel at the right change to provide controls for each layer as you click it.
The collection of all layers, the user view, and all annotations is stored as a JSON object called the state.
The basic controls for navigation are:
left click/dragslides the imagery in X/Y and rotates the 3d view.scroll wheel up/downmoves the imagery in Z. (track pad two finger scroll; keypad , or . )right clickjumps the 3d view to the clicked location in either the imagery or on a segmented object.double left clickselects a segmentation and loads its mesh into the 3d view. Double clicking on a selected neuron deselects it.control-scrollzooms the view under the cursor in or out. (track pad two finger expand/contract)zsnaps the view to the closest right angle.
You can paste a position into Neuroglancer by clicking the x, y, z coordinate in the upper left corner and pasting a space or comma-separated list of numbers and hitting enter. Note that Neuroglancer always works in voxel units, and you can see the resolution of the voxels in the extreme upper left corner.
Selecting objects#
The most direct way to select a neuron is to double click in the imagery to select the object under your cursor. This will load all the voxels associated with that object and also display its mesh in the 3d view.
To see the list of selected objects, you can select the segmentation tab (right click on the seg tab).
Underneath the list of options, there is a list of selected root ids and the color assigned to them in the view.
You can change colors of all neurons randomly by pressing l or individually change colors as desired.
In addition, you can press the checkbox to hide a selected object while keeping it in the list, or deselect it by clicking on the number itself. You can also copy a root id by pressing the clipboard icon next to its number, or copy all selected root ids by pressing the clipboard icon above the list.
This selection list also allows you to select objects by pasting one or more root ids into the text box at the top of the list and pressing enter.
Annotations#
Annotations are stored in an annotation layer.
The default state has an annotation layer called ann, but you can always add new annotation layers by command-clicking the + button to the right of the layer tabs.
To create an annotation, select the layer (right click on the tab), and then click the icon representing the type of annotation you want to use. The most basic annotation is a point, which is the icon to the left of the list. The icon will change to having a green background when selected.
Now if you control-click in either the imagery or the 3d view, you will create a point annotation at the clicked location. The annotation will appear in the list to the right, with its coordinate (in voxels, not nanometers) displayed. Clicking any annotation in the list will jump to that annotation in 3d space. Each annotation layer can have one color, which you can change with the color picker to the left of the annotation list.
Saving and sharing states#
Like many other websites that require logins, you cannot simply send your URL ot another person to have them see the view.
Instead, to save the current state and make it available to yourself or others in the future, you need to save the state with the Share button at the top right corner.
This will then give you a URL that you can copy and share with others or paste yourself.
A typical sharing URL looks like the following:
https://spelunker.cave-explorer.org/#!middleauth+https://global.daf-apis.com/nglstate/api/v1/4658335189041152
The first part is the URL for the Neuroglancer viewer, while the part after the ?json_url= is a URL that points to a JSON file that contains the state.
The number at the end of the URL is used to uniquely identify the state and can be used programmatically to retrieve information.
Warning
If a URL contains ?local_id= instead of ?json_url, that means that it cannot be viewed by anyone else or even in another browser on your own computer.
Navigating Annotations#
Annotations in an annotation layer can be right-clicked on to jump to them, but can also be navigated as a list.
To see the list of annotations, select the annotation layer (right click on the tab).
Each annotation is listed as its location in Neuroglance voxel coordinates.
Clicking on an row in this annotation list will not only jump to it in the view, but also select it.
You can see the information about the selected neuron in the lower right corner.
Once an annotation is selected, any associated root ids are loaded.
The keys [ and ] will jump to the previous and next annotations in the list, respectively.
Each annotation can have a full-text description associated with it for adding notes. This can be added in the lower right corner.
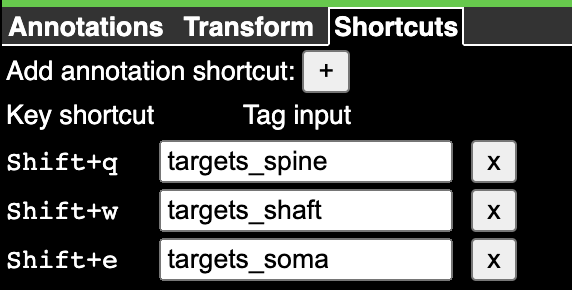
Fig. 29 Annotation tags after populating them manually.#
However, the most convenient way to label data quickly is through Tags.
To add tags, click on the Shortcuts tab within the Annotation widget on the right, and then click on the + button to add a new tag.
Each tag gets a text label and a key command to activate or deactivate it for a given annotation.
By default, the first tag is activated by pressing shift-q, the second by pressing shift-w, and so on down the qwerty line.
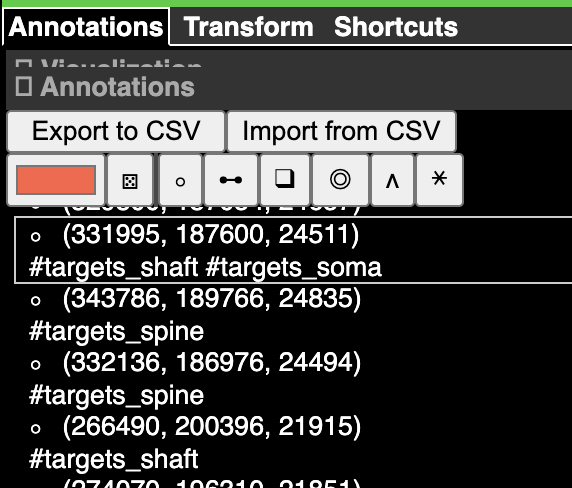
Fig. 30 Annotation tags applied to annotations. The labels with with the # symbol indicate a tag is present.#
Now when you select an annotation, you can press the key command to attach that tag to it.
Pressing the same key command will remove the tag.
Any number of tags can be added to each annotation.
Together with the [ and ] keys to navigate the list, this allows you to quickly label a large number of annotations.
Programmatic Interaction with Neuroglancer States#
Important
Before using any programmatic access to the data, you first need to set up your CAVEclient token.
Visualizing data in Neuroglancer is one of the easiest ways to explore it in its full context.
The python package nglui was made to make it easy to generate Neuroglancer states from data, particularly pandas dataframes, in a progammatic manner.
The package can be installed with pip install nglui.
Note
The nglui package interacts prominently with caveclient and annotations queried from the database.
See the section on querying the database to learn more.
Parsing Neuroglancer states#
The nglui.parser module offers a number of tools to get information about neuroglancer states out of the JSON format that neuroglancer uses. The recommended approach here is to pass a dictionary representation of the JSON object the StateParser class and build various kinds of dataframes from it.
The simplest way to parse the annotations in a Neuroglancer state is to first save the state using the Share button, and then copy the state id (the last number in the URL).
Important
This requires nglui version >= 3.5.0 and <4.0.0
from caveclient import CAVEclient
from nglui import parser

client = CAVEclient('minnie65_public')
state_json = client.state.get_state_json(6107390807113728)
state_parser = parser.StateParser(state_json)
You can now access different aspects of the state through this state_parser object.
Layer Data#
For example, to get a list of all layers and their core info, you can use the layer_dataframe method
state_parser.layer_dataframe()
will give you a table with a row for each layer and columns for layer name, type, source, and whether the layer is archived (i.e. visible) or not.
You can also get a list of all selected segments with the selection_dataframe method.
state_parser.selection_dataframe()
will give you a dataframe where each row is a selected segment, and columns show layer name, segment id, and whether or not the segment is visible.
Annotation Data#
Finally, you can get a list of all annotations withthe annotation_dataframe method. h
state_parser.annotation_dataframe()
will give you a dataframe where each row is an annotation, and columns show layer name, points locations, annotation type, annotation id, linked segmentations, tags, etc.
If you are using tags, the expand_tags=True argument will create a column for every tag and assign a boolean value to the row based on whether the tag is present in the annotation.
Another option that is sometimes useful is split_points=True, which will create a separate column for each x, y, or z coordinate in the annotation.od.d..
Generating Neuroglancer States from Data#
The nglui.statebuilder package is used to build Neuroglancer states that express arbitrary data.
The general pattern is that one makes a “StateBuilder” object that has rules for how to build a Neuroglancer state layer by layer, including selecting certain neurons, and populate layers of annotations.
You then pass a DataFrame to the StateBuiler, and the rules tell it how to render the DataFrame into a Neuroglancer link.
The same set of rules can be used on similar dataframes but with different data, such as synapses from different neurons.
To understand the detailed use of the package, please see the the NGLUI documentation (and mind the version differences).
However, a number of basic helper functions allow nglui to be used for common functions in just a few lines.
For example, to generate a Neuroglancer state that shows a neuron and its synaptic inputs and outputs, we can use the make_neuron_neuroglancer_link helper function.
from caveclient import CAVEclient
from nglui.statebuilder import helpers

client = CAVEclient('minnie65_public')

helpers.make_neuron_neuroglancer_link(
    client,
    root_ids=864691135441799752,
    show_inputs=True,
    show_outputs=True,
    target_site='cave-explorer',
)
(<nglui.statebuilder.statebuilder.ChainedStateBuilder at 0x7fe98359cdc0>,
 [              root_id
  0  864691135441799752,
               id                          created  superceded_id valid  \
  148   187770131 2020-11-04 07:36:45.318243+00:00            NaN     t
  181   173033456 2020-11-04 07:36:40.962629+00:00            NaN     t
  185   180581870 2020-11-04 07:36:39.970777+00:00            NaN     t
  706   165299728 2020-11-04 10:15:19.696268+00:00            NaN     t
  760   194395546 2020-11-04 07:36:39.970777+00:00            NaN     t
  ...         ...                              ...            ...   ...
  4394  163655586 2020-11-04 08:04:15.811361+00:00            NaN     t
  2434  192764780 2020-11-04 08:37:14.648836+00:00            NaN     t
  2843  194462083 2020-11-04 11:47:21.612406+00:00            NaN     t
  1622  165048795 2020-11-04 14:51:00.402773+00:00            NaN     t
  398   207066737 2020-11-04 08:40:11.026602+00:00            NaN     t

        pre_pt_position_x  pre_pt_position_y  pre_pt_position_z  \
  148              192446             119188              20874
  181              187016             115800              21592
  185              191728             119586              20929
  706              183288             120324              19046
  760              197002             119200              21290
  ...                 ...                ...                ...
  4394             180908             105584              23021
  2434             199496             110902              22560
  2843             198824             103000              21123
  1622             183558             104924              21713
  398              204946             114046              19339

        post_pt_position_x  post_pt_position_y  post_pt_position_z  \
  148               192498              119260               20887
  181               186944              115842               21583
  185               191820              119510               20927
  706               183390              120246               19047
  760               196906              119330               21295
  ...                  ...                 ...                 ...
  4394              180918              105622               23031
  2434              199538              110820               22558
  2843              198780              102884               21131
  1622              183576              104896               21720
  398               204922              114008               19338

        ctr_pt_position_x  ctr_pt_position_y  ctr_pt_position_z  size  \
  148              192419             119264              20880  2228
  181              187006             115770              21584  5096
  185              191780             119582              20929  2684
  706              183354             120302              19043  3348
  760              196972             119256              21290  2632
  ...                 ...                ...                ...   ...
  4394             180923             105549              23019  9432
  2434             199524             110864              22557  2324
  2843             198816             102938              21126  2400
  1622             183590             104922              21714  3900
  398              204954             114014              19341  2908

        pre_pt_supervoxel_id      pre_pt_root_id  post_pt_supervoxel_id  \
  148      91205727213274611  864691136010404012      91205727213292378
  181      90501558869035020  864691136010404012      90501558869029887
  185      91135427188633134  864691136010404012      91135427188640584
  706      89939227055371613  864691136010404012      90009595799564883
  760      91839045977868681  864691136010404012      91839045977876607
  ...                    ...                 ...                    ...
  4394     89655759684092822  864691131915395450      89655759684111608
  2434     92189790388170110  864691131889640562      92189790388169159
  2843     92118321931148216  864691131872674215      92118321931159175
  1622     90007534550924139  864691131822625017      90007534550931742
  398      92964258421597883  864691131794106944      92964258421600601

           post_pt_root_id
  148   864691135441799752
  181   864691135441799752
  185   864691135441799752
  706   864691135441799752
  760   864691135441799752
  ...                  ...
  4394  864691135441799752
  2434  864691135441799752
  2843  864691135441799752
  1622  864691135441799752
  398   864691135441799752

  [5681 rows x 18 columns],
               id                          created  superceded_id valid  \
  346   188722054 2020-11-04 09:25:30.539182+00:00            NaN     t
  690   162924603 2020-11-04 07:53:27.186324+00:00            NaN     t
  1496  162925312 2020-11-04 07:53:40.155613+00:00            NaN     t
  1633  151730182 2020-11-04 09:39:15.637331+00:00            NaN     t
  1880  151623255 2020-11-04 09:25:21.569113+00:00            NaN     t
  ...         ...                              ...            ...   ...
  888   343810565 2020-11-04 14:11:24.798884+00:00            NaN     t
  178   173134723 2020-11-04 08:05:35.030894+00:00            NaN     t
  2173  151242210 2020-11-04 11:30:20.588254+00:00            NaN     t
  584   191679382 2020-11-04 11:18:38.997022+00:00            NaN     t
  1135  189709681 2020-11-04 13:37:56.862784+00:00            NaN     t

        pre_pt_position_x  pre_pt_position_y  pre_pt_position_z  \
  346              192024             157924              21904
  690              178168             232030              24446
  1496             179160             232006              24380
  1633             174736             101966              22287
  1880             172330              99914              22442
  ...                 ...                ...                ...
  888              287542              91132              20636
  178              186522             121764              20250
  2173             171458              98266              23004
  584              196276             115870              19738
  1135             192476             195542              20379

        post_pt_position_x  post_pt_position_y  post_pt_position_z  \
  346               192082              157964               21903
  690               178168              232072               24455
  1496              179154              231910               24379
  1633              174738              101932               22276
  1880              172268               99934               22438
  ...                  ...                 ...                 ...
  888               287438               91160               20648
  178               186594              121722               20262
  2173              171482               98312               22999
  584               196228              115776               19737
  1135              192454              195502               20373

        ctr_pt_position_x  ctr_pt_position_y  ctr_pt_position_z   size  \
  346              192036             157910              21903   3444
  690              178156             232137              24449  21364
  1496             179182             231938              24382   9788
  1633             174758             101982              22281   6060
  1880             172254              99910              22444  16348
  ...                 ...                ...                ...    ...
  888              287480              91184              20643  12084
  178              186563             121727              20258   3460
  2173             171448              98312              22999   2000
  584              196254             115798              19739   2376
  1135             192426             195532              20374   3264

        pre_pt_supervoxel_id      pre_pt_root_id  post_pt_supervoxel_id  \
  346      91140581283589200  864691135441799752      91210950027716191
  690      89250521130992077  864691135441799752      89250521131006598
  1496     89391258619218995  864691135441799752      89391258619228831
  1633     88810853650201222  864691135441799752      88810853650184703
  1880     88458735051562945  864691135441799752      88458735051562962
  ...                    ...                 ...                    ...
  888     104290534058860946  864691135441799752     104290534058874947
  178      90432014557495008  864691135441799752      90432014557505248
  2173     88317791471923132  864691135441799752      88317791471919946
  584      91768195996011195  864691135441799752      91768195996012041
  1135     91215966348199249  864691135441799752      91215966348192937

           post_pt_root_id
  346   864691135517376211
  690   864691135517376211
  1496  864691135517376211
  1633  864691135517376211
  1880  864691135517376211
  ...                  ...
  888   864691131857510409
  178   864691131757970238
  2173  864691131746523286
  584   864691131737138899
  1135  864691131599924730

  [2231 rows x 18 columns]])
The main helper functions are:
make_neuron_neuroglancer_link- Shows one or more neurons and, optionally, synaptic inputs and/or outputs.make_synapse_neuroglancer_link- Using a pre-downloaded synapse table, make a link that shows the synapse and the listed synaptic partners.make_point_statebuilder- Generate a statebuilder that to map a dataframe containing points (by default, formatted like a cell types table) to a Neuroglancer link.
In all cases, please look at the docstrings for more information on how to use the functions.