Single Cell Morphology Data Access#
In order to access data on the cloud directly, you can use python. The packages you need to use are: cloudvolume and meshparty. Cloud volume is a toolbox that helps you read and write data from the cloud, and meshparty is a toolbox that enables you to perform analysis on the data. So what we will do is to first read in the data using cloud volume and then convert it to a meshparty skeleton object so that we can analyse it.
import matplotlib.pyplot as plt
import cloudvolume
from meshparty import skeleton
import skeleton_plot as skelplot
To read in one neuron morphology, you need to use the cloud location of the data and the skeleton id that you are interested in accessing. Cloudvolume can then read the data as follows:
input_directory = f"file:///data/exaSPIM_609281_2022-11-03_13-49-18_reconstructions/precomputed/"
skeleton_id = 1

cv_obj = cloudvolume.CloudVolume(input_directory) # Initialize cloud volume
cv_sk = cv_obj.skeleton.get(skeleton_id) #load an example skeleton
You can then use the meshparty functions for skeletonanalysis already developed. It provides a nice function for taking in information about the skeleton and initializing the object:
sk = skeleton.Skeleton(cv_sk.vertices,
                       cv_sk.edges,
                       vertex_properties={'radius': cv_sk.radius,
                                          'compartment': cv_sk.compartment},
                       root = len(cv_sk.edges),
                       remove_zero_length_edges = False)
From this you can examine the skeleton features as described (here)[skeletons]. Note, however, that unlike EM data, skeletons of neurons from the single cell morphology dataset do not have meshes or synapse annotations. They do have CCF annotations, such that each node is annotated with the (CCF)[common_coordinate_framework] structure where it is located.
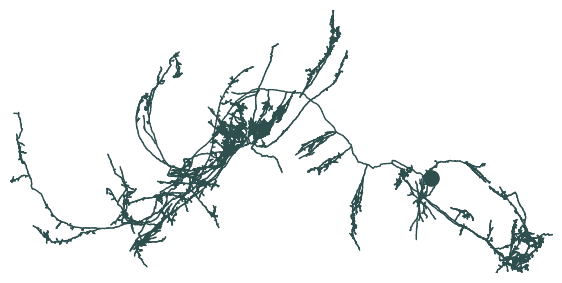
f, ax = plt.subplots(figsize=(7, 10))
skelplot.plot_tools.plot_skel(
    sk,
    line_width = 1,
    plot_soma = True,
    invert_y = True,
    x="x",
    y="y",
)

ax.spines['right'].set_visible(False)
ax.spines['left'].set_visible(False)
ax.spines['top'].set_visible(False)
ax.spines['bottom'].set_visible(False)
ax.axis('off')
(3795229.0, 14178638.0, 7191575.0, 2148295.0)