Quick start guide#
Tutorial overview#
A short introduction to the Visual Coding Neuropixels data and SDK. For more information, see the full example notebook.
This tutorial will demonstrate how to make the following:
import os

import numpy as np
import pandas as pd
import matplotlib.pyplot as plt
%matplotlib inline

from allensdk.brain_observatory.ecephys.ecephys_project_cache import EcephysProjectCache
/opt/envs/allensdk/lib/python3.10/site-packages/tqdm/auto.py:21: TqdmWarning: IProgress not found. Please update jupyter and ipywidgets. See https://ipywidgets.readthedocs.io/en/stable/user_install.html
  from .autonotebook import tqdm as notebook_tqdm
The EcephysProjectCache is the main entry point to the Visual Coding Neuropixels dataset. It allows you to download data for individual recording sessions and view cross-session summary information.
# Example cache directory path, it determines where downloaded data will be stored
output_dir = '/root/capsule/data/allen-brain-observatory/visual-coding-neuropixels/ecephys-cache/'
manifest_path = os.path.join(output_dir, "manifest.json")
cache = EcephysProjectCache.from_warehouse(manifest=manifest_path)
print(cache.get_all_session_types())
['brain_observatory_1.1', 'functional_connectivity']
This dataset contains sessions in which two sets of stimuli were presented. The "brain_observatory_1.1" sessions are (almost exactly) the same as Visual Coding 2P sessions.
sessions = cache.get_session_table()
brain_observatory_type_sessions = sessions[sessions["session_type"] == "brain_observatory_1.1"]
brain_observatory_type_sessions.tail()
| published_at | specimen_id | session_type | age_in_days | sex | full_genotype | unit_count | channel_count | probe_count | ecephys_structure_acronyms | |
|---|---|---|---|---|---|---|---|---|---|---|
| id | ||||||||||
| 773418906 | 2019-10-03T00:00:00Z | 757329624 | brain_observatory_1.1 | 124.0 | F | Pvalb-IRES-Cre/wt;Ai32(RCL-ChR2(H134R)_EYFP)/wt | 546 | 2232 | 6 | [PPT, NOT, SUB, ProS, CA1, VISam, nan, APN, DG... |
| 791319847 | 2019-10-03T00:00:00Z | 769360779 | brain_observatory_1.1 | 116.0 | M | Vip-IRES-Cre/wt;Ai32(RCL-ChR2(H134R)_EYFP)/wt | 555 | 2229 | 6 | [APN, DG, CA1, VISam, nan, LP, TH, VISpm, POL,... |
| 797828357 | 2019-10-03T00:00:00Z | 776061251 | brain_observatory_1.1 | 107.0 | M | Pvalb-IRES-Cre/wt;Ai32(RCL-ChR2(H134R)_EYFP)/wt | 611 | 2232 | 6 | [PPT, MB, APN, NOT, HPF, ProS, CA1, VISam, nan... |
| 798911424 | 2019-10-03T00:00:00Z | 775876828 | brain_observatory_1.1 | 110.0 | F | Vip-IRES-Cre/wt;Ai32(RCL-ChR2(H134R)_EYFP)/wt | 825 | 2233 | 6 | [APN, TH, Eth, LP, DG, HPF, CA3, CA1, VISrl, n... |
| 799864342 | 2019-10-03T00:00:00Z | 772616823 | brain_observatory_1.1 | 129.0 | M | wt/wt | 604 | 2233 | 6 | [APN, POL, LP, DG, CA1, VISrl, nan, LGd, CA3, ... |
Peristimulus time histograms#
We are going to pick a session arbitrarily and download its spike data.
session_id = 791319847
session = cache.get_session_data(session_id)
/opt/envs/allensdk/lib/python3.10/site-packages/hdmf/utils.py:668: UserWarning: Ignoring cached namespace 'hdmf-common' version 1.1.3 because version 1.8.0 is already loaded.
  return func(args[0], **pargs)
/opt/envs/allensdk/lib/python3.10/site-packages/hdmf/utils.py:668: UserWarning: Ignoring cached namespace 'core' version 2.2.2 because version 2.7.0 is already loaded.
  return func(args[0], **pargs)
We can get a high-level summary of this session by accessing its metadata attribute:
session.metadata
/opt/envs/allensdk/lib/python3.10/site-packages/hdmf/utils.py:668: UserWarning: Ignoring cached namespace 'hdmf-common' version 1.1.3 because version 1.8.0 is already loaded.
  return func(args[0], **pargs)
/opt/envs/allensdk/lib/python3.10/site-packages/hdmf/utils.py:668: UserWarning: Ignoring cached namespace 'core' version 2.2.2 because version 2.7.0 is already loaded.
  return func(args[0], **pargs)
{'specimen_name': 'Vip-IRES-Cre;Ai32-417678',
 'session_type': 'brain_observatory_1.1',
 'full_genotype': 'Vip-IRES-Cre/wt;Ai32(RCL-ChR2(H134R)_EYFP)/wt',
 'sex': 'M',
 'age_in_days': 116.0,
 'rig_equipment_name': 'NP.1',
 'num_units': 555,
 'num_channels': 2229,
 'num_probes': 6,
 'num_stimulus_presentations': 70931,
 'session_start_time': datetime.datetime(2019, 1, 8, 13, 55, 1, tzinfo=tzoffset(None, -28800)),
 'ecephys_session_id': 791319847,
 'structure_acronyms': ['VISpm',
  nan,
  'LP',
  'TH',
  'DG',
  'CA1',
  'CA3',
  'CA2',
  'VISl',
  'ZI',
  'LGv',
  'VISal',
  'APN',
  'POL',
  'VISrl',
  'VISam',
  'LGd',
  'ProS',
  'SUB',
  'VISp'],
 'stimulus_names': ['spontaneous',
  'gabors',
  'flashes',
  'drifting_gratings',
  'natural_movie_three',
  'natural_movie_one',
  'static_gratings',
  'natural_scenes',
  'drifting_gratings_contrast']}
We can also take a look at how many units were recorded in each brain structure:
session.structurewise_unit_counts
VISp     93
CA1      85
VISrl    58
VISl     56
VISam    49
VISal    43
SUB      41
CA3      33
DG       32
VISpm    17
LGv      16
LP        9
LGd       8
TH        4
ZI        4
CA2       3
POL       3
ProS      1
Name: ecephys_structure_acronym, dtype: int64
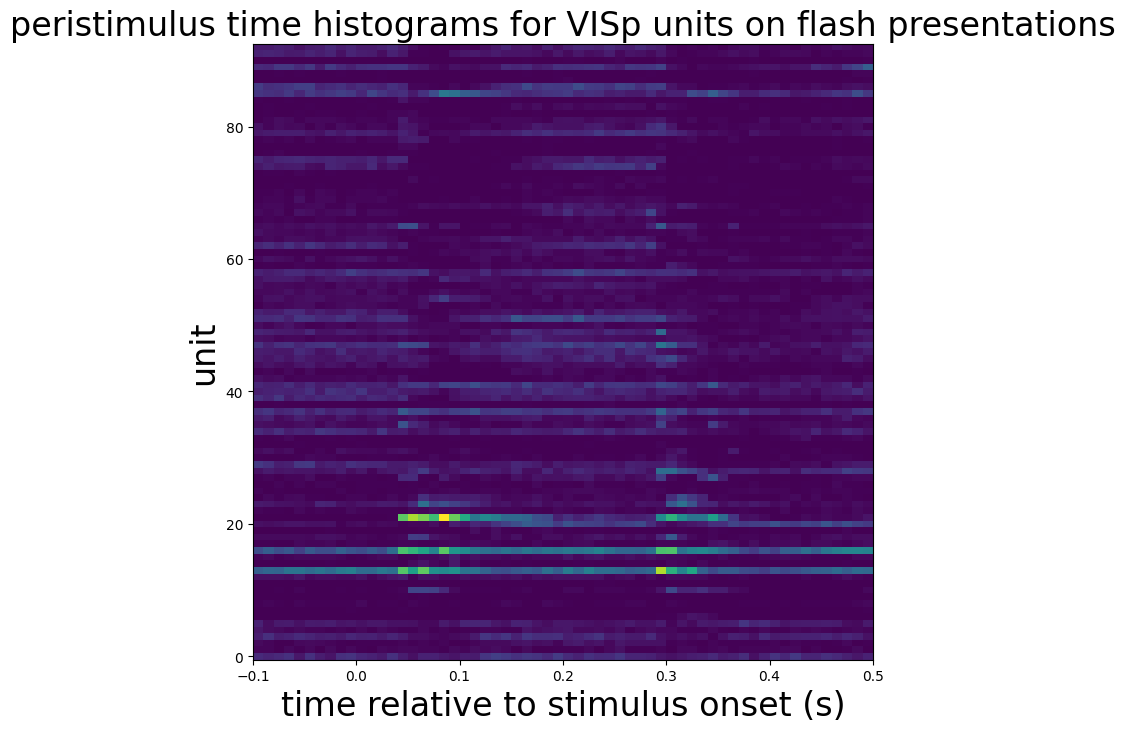
Now that we’ve gotten spike data, we can create peristimulus time histograms.
presentations = session.get_stimulus_table("flashes")
units = session.units[session.units["ecephys_structure_acronym"] == 'VISp']

time_step = 0.01
time_bins = np.arange(-0.1, 0.5 + time_step, time_step)

histograms = session.presentationwise_spike_counts(
    stimulus_presentation_ids=presentations.index.values,
    bin_edges=time_bins,
    unit_ids=units.index.values
)

histograms.coords
Coordinates:
  * stimulus_presentation_id         (stimulus_presentation_id) int64 3647 .....
  * time_relative_to_stimulus_onset  (time_relative_to_stimulus_onset) float64 ...
  * unit_id                          (unit_id) int64 951061537 ... 951062679
mean_histograms = histograms.mean(dim="stimulus_presentation_id")

fig, ax = plt.subplots(figsize=(8, 8))
ax.pcolormesh(
    mean_histograms["time_relative_to_stimulus_onset"],
    np.arange(mean_histograms["unit_id"].size),
    mean_histograms.T,
    vmin=0,
    vmax=1
)

ax.set_ylabel("unit", fontsize=24)
ax.set_xlabel("time relative to stimulus onset (s)", fontsize=24)
ax.set_title("peristimulus time histograms for VISp units on flash presentations", fontsize=24)

plt.show()

Decoding visual stimuli#
First, we need to extract spikes. We will do using EcephysSession.presentationwise_spike_times, which returns spikes annotated by the unit that emitted them and the stimulus presentation during which they were emitted.
scene_presentations = session.get_stimulus_table("natural_scenes")
visp_units = session.units[session.units["ecephys_structure_acronym"] == "VISp"]

spikes = session.presentationwise_spike_times(
    stimulus_presentation_ids=scene_presentations.index.values,
    unit_ids=visp_units.index.values[:]
)

spikes
| stimulus_presentation_id | unit_id | time_since_stimulus_presentation_onset | |
|---|---|---|---|
| spike_time | |||
| 5914.084307 | 51355 | 951061801 | 0.001665 |
| 5914.085207 | 51355 | 951062307 | 0.002565 |
| 5914.087241 | 51355 | 951062610 | 0.004598 |
| 5914.090107 | 51355 | 951061993 | 0.007465 |
| 5914.090407 | 51355 | 951062605 | 0.007765 |
| ... | ... | ... | ... |
| 8573.801313 | 68228 | 951061801 | 0.244631 |
| 8573.801613 | 68228 | 951062175 | 0.244931 |
| 8573.805379 | 68228 | 951062898 | 0.248698 |
| 8573.805546 | 68228 | 951061537 | 0.248865 |
| 8573.805846 | 68228 | 951062143 | 0.249165 |
1224681 rows × 3 columns
Next, we will convert these into a num_presentations X num_units matrix, which will serve as our input data.
spikes["count"] = np.zeros(spikes.shape[0])
spikes = spikes.groupby(["stimulus_presentation_id", "unit_id"]).count()

design = pd.pivot_table(
    spikes,
    values="count",
    index="stimulus_presentation_id",
    columns="unit_id",
    fill_value=0.0,
    aggfunc=np.sum
)

design
| unit_id | 951061537 | 951061549 | 951061556 | 951061568 | 951061574 | 951061607 | 951061637 | 951061643 | 951061649 | 951061655 | ... | 951062587 | 951062600 | 951062605 | 951062610 | 951062647 | 951062679 | 951062808 | 951062833 | 951062854 | 951062898 |
|---|---|---|---|---|---|---|---|---|---|---|---|---|---|---|---|---|---|---|---|---|---|
| stimulus_presentation_id | |||||||||||||||||||||
| 51355 | 1 | 3 | 1 | 1 | 2 | 3 | 2 | 1 | 2 | 0 | ... | 15 | 0 | 15 | 5 | 11 | 5 | 0 | 0 | 2 | 1 |
| 51356 | 2 | 0 | 1 | 2 | 2 | 1 | 1 | 3 | 4 | 0 | ... | 10 | 0 | 10 | 3 | 16 | 3 | 1 | 0 | 2 | 0 |
| 51357 | 0 | 0 | 1 | 1 | 1 | 1 | 1 | 1 | 0 | 0 | ... | 7 | 0 | 13 | 0 | 14 | 6 | 12 | 3 | 2 | 5 |
| 51358 | 0 | 2 | 1 | 3 | 4 | 1 | 0 | 2 | 1 | 2 | ... | 6 | 0 | 11 | 7 | 8 | 3 | 0 | 0 | 0 | 3 |
| 51359 | 1 | 0 | 1 | 2 | 2 | 1 | 0 | 1 | 0 | 2 | ... | 7 | 0 | 15 | 4 | 10 | 5 | 11 | 2 | 0 | 7 |
| ... | ... | ... | ... | ... | ... | ... | ... | ... | ... | ... | ... | ... | ... | ... | ... | ... | ... | ... | ... | ... | ... |
| 68224 | 2 | 0 | 4 | 2 | 1 | 0 | 1 | 0 | 1 | 0 | ... | 2 | 0 | 11 | 16 | 3 | 0 | 4 | 0 | 0 | 1 |
| 68225 | 0 | 0 | 9 | 0 | 2 | 0 | 1 | 0 | 0 | 0 | ... | 5 | 0 | 13 | 5 | 5 | 0 | 3 | 0 | 0 | 5 |
| 68226 | 1 | 0 | 1 | 3 | 2 | 0 | 1 | 0 | 0 | 0 | ... | 15 | 0 | 12 | 2 | 10 | 0 | 4 | 0 | 1 | 5 |
| 68227 | 1 | 0 | 2 | 3 | 3 | 0 | 0 | 0 | 1 | 0 | ... | 9 | 1 | 4 | 2 | 5 | 0 | 1 | 0 | 1 | 7 |
| 68228 | 3 | 1 | 0 | 0 | 1 | 1 | 0 | 0 | 0 | 0 | ... | 9 | 0 | 18 | 6 | 4 | 4 | 0 | 0 | 0 | 8 |
5950 rows × 93 columns
… with targets being the numeric identifiers of the images presented.
targets = scene_presentations.loc[design.index.values, "frame"]
targets
stimulus_presentation_id
51355     14.0
51356      0.0
51357      8.0
51358    106.0
51359      8.0
         ...
68224     35.0
68225     35.0
68226     73.0
68227     95.0
68228     95.0
Name: frame, Length: 5950, dtype: object
from sklearn import svm
from sklearn.model_selection import KFold
from sklearn.metrics import confusion_matrix
design_arr = design.values.astype(float)
targets_arr = targets.values.astype(int)

labels = np.unique(targets_arr)
accuracies = []
confusions = []

for train_indices, test_indices in KFold(n_splits=5).split(design_arr):

    clf = svm.SVC(gamma="scale", kernel="rbf")
    clf.fit(design_arr[train_indices], targets_arr[train_indices])

    test_targets = targets_arr[test_indices]
    test_predictions = clf.predict(design_arr[test_indices])

    accuracy = 1 - (np.count_nonzero(test_predictions - test_targets) / test_predictions.size)
    print(accuracy)

    accuracies.append(accuracy)
    confusions.append(confusion_matrix(y_true=test_targets, y_pred=test_predictions, labels=labels))
0.41428571428571426
0.4966386554621849
0.49747899159663866
0.5067226890756302
0.473109243697479
print(f"mean accuracy: {np.mean(accuracy)}")
print(f"chance: {1/labels.size}")
mean accuracy: 0.473109243697479
chance: 0.008403361344537815
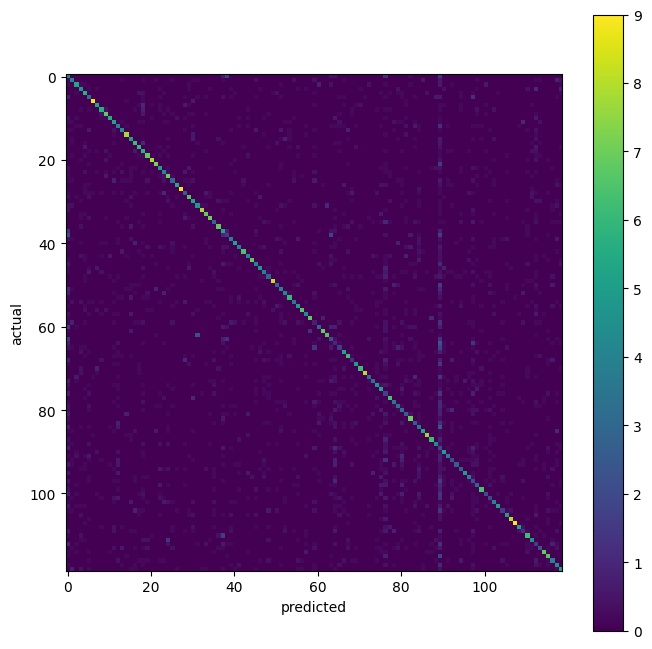
imagewise performance#
mean_confusion = np.mean(confusions, axis=0)

fig, ax = plt.subplots(figsize=(8, 8))

img = ax.imshow(mean_confusion)
fig.colorbar(img)

ax.set_ylabel("actual")
ax.set_xlabel("predicted")

plt.show()

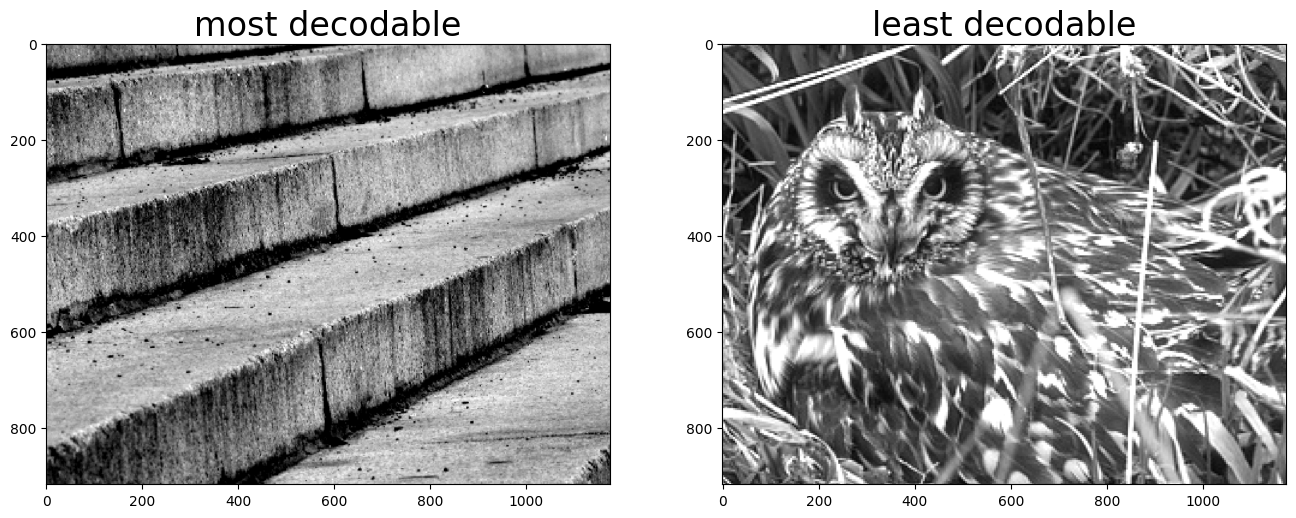
best = labels[np.argmax(np.diag(mean_confusion))]
worst = labels[np.argmin(np.diag(mean_confusion))]

fig, ax = plt.subplots(1, 2, figsize=(16, 8))

best_image = cache.get_natural_scene_template(best)
ax[0].imshow(best_image, cmap=plt.cm.gray)
ax[0].set_title("most decodable", fontsize=24)

worst_image = cache.get_natural_scene_template(worst)
ax[1].imshow(worst_image, cmap=plt.cm.gray)
ax[1].set_title("least decodable", fontsize=24)


plt.show()

